
Table of Contents
- Insights Hub Outliers
- What kinds of automated data quality checks are available?
- Higg FEM Outlier Detection Methodology
- What can I expect with Outlier Detection?
- What is considered an Outlier?
- FDM to FEM Outlier Detection
- FAQ
High-quality data is the most valuable component of the Higg Index and the Worldly platform. In order to maintain high-quality data, it is important to identify and correct any outliers.
An Outlier is a data point or calculation that differs significantly from our historical observations and expectations.
Insights Hub Outliers
In the left column of Insights Hub, you can see how many outliers were excluded from the Insights Hub Dashboard. Next to the red X, you'll see the total number of outliers excluded, along with an "i" icon.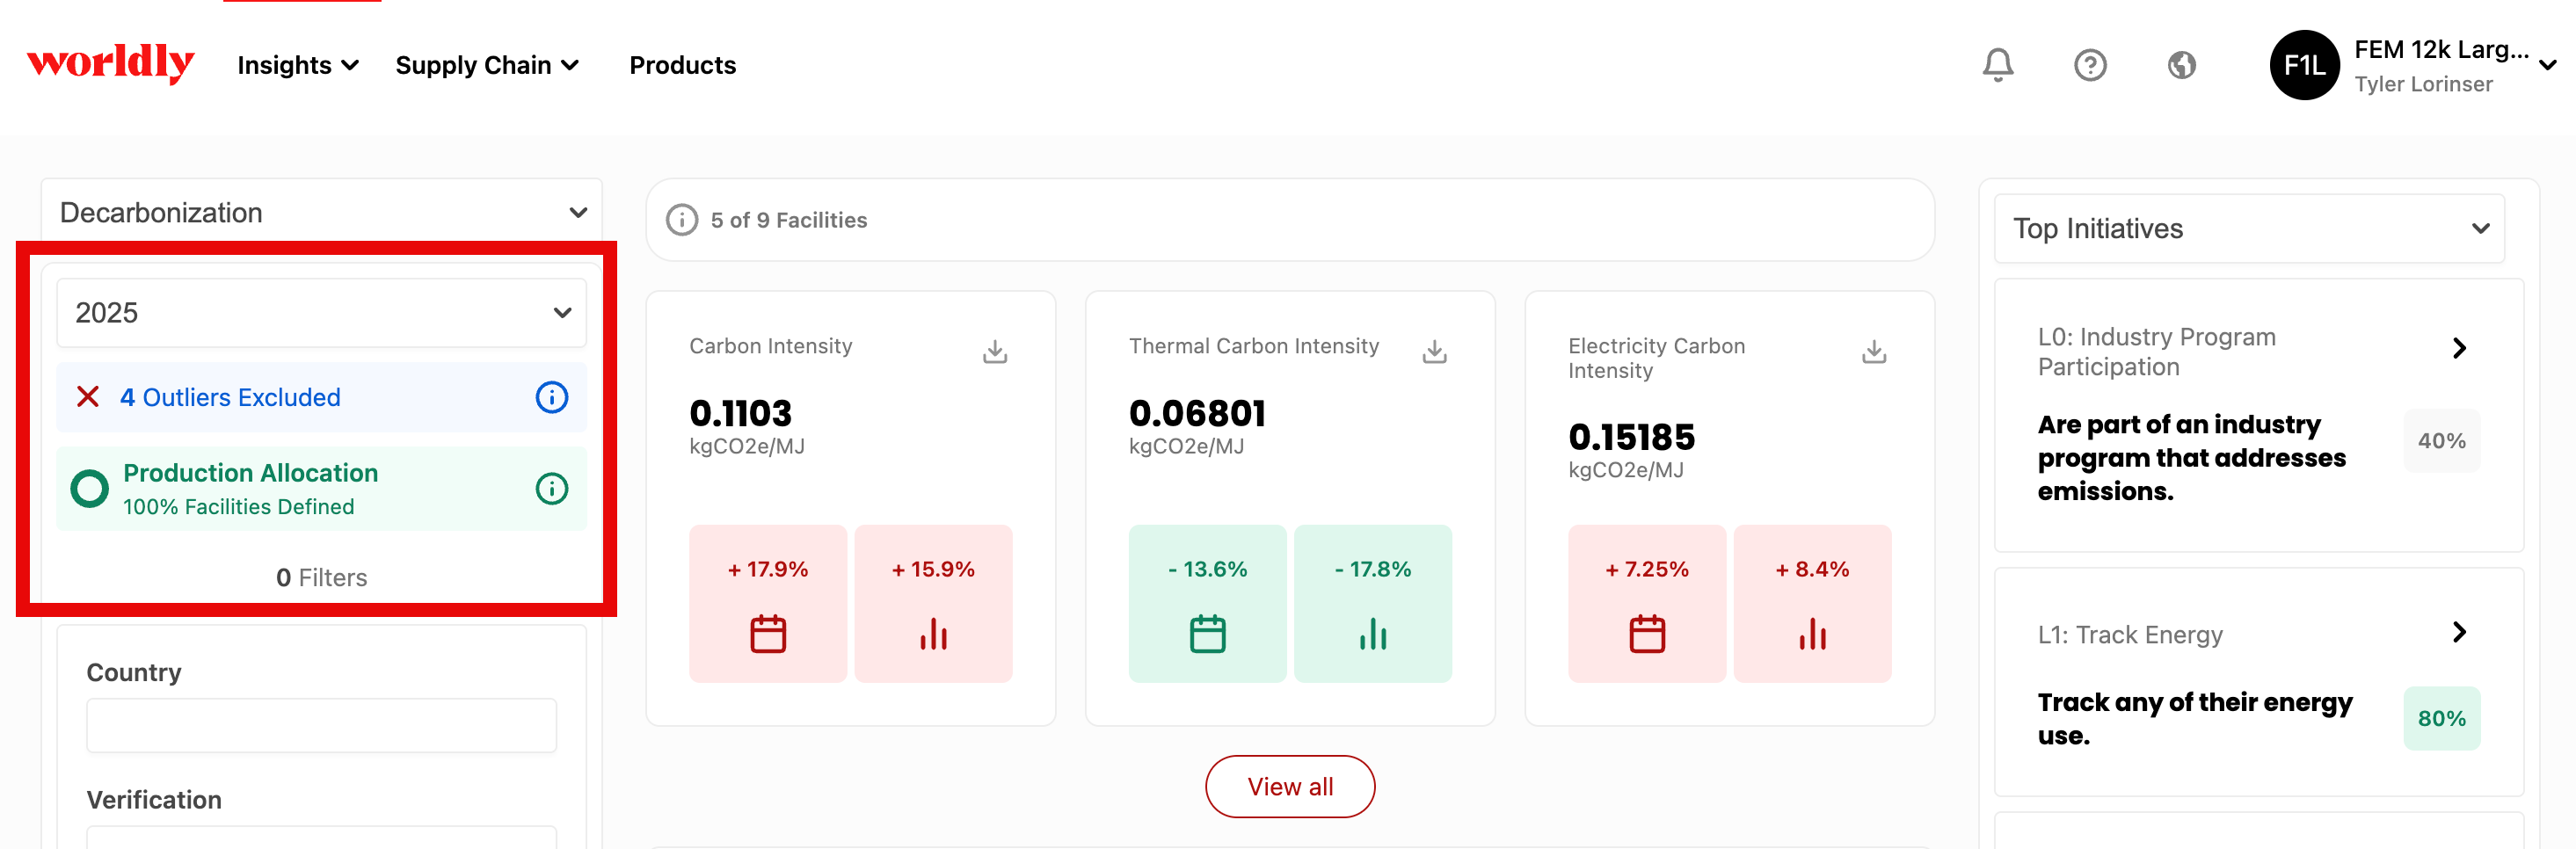
Click on the icon to access the Data Worth A Second Look window.
There are outliers detected in 4 assessments, which are automatically excluded from the Insights Hub dashboard. Click on the checkbox to Include Outliers in the Insights Hub Dashboard. This will update the dashboard to include the 4 assessments with detected outliers.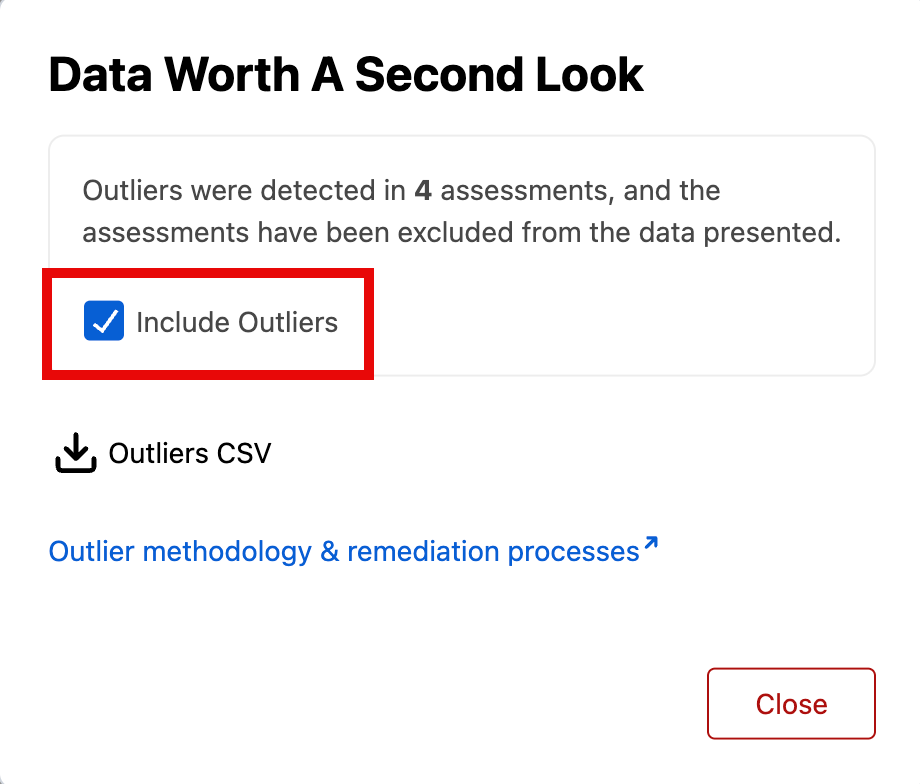
Click Outliers CSV to download a CSV file of the assessments with detected outliers.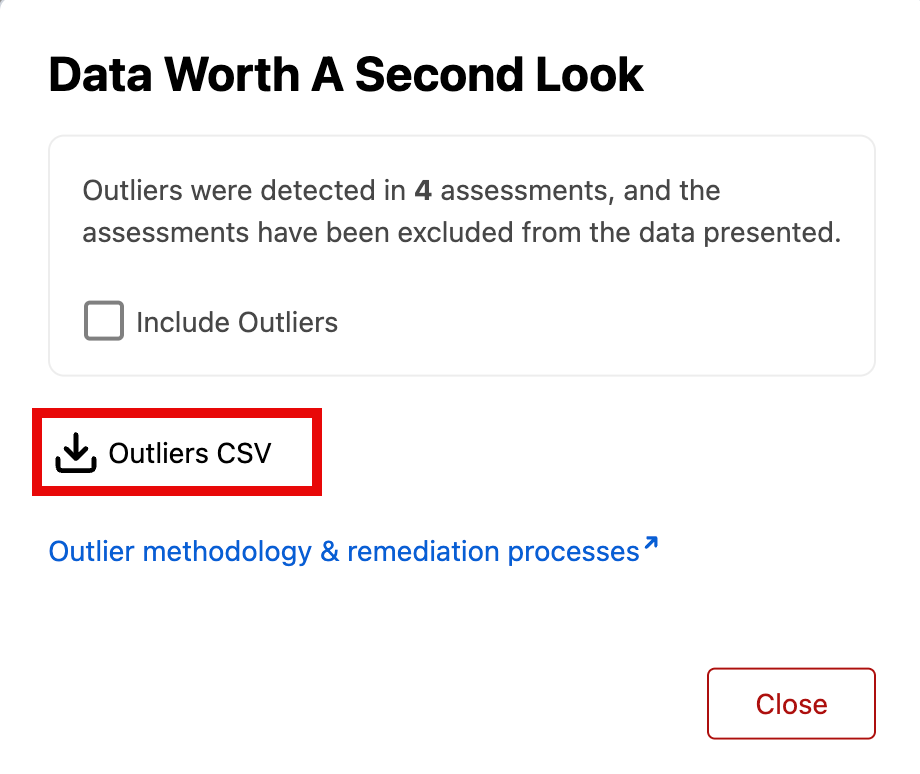
The table in the file includes information about the assessments, including Worldly ID, Facility, and Assessment ID.
The other columns in the table are used to check for outliers, including:
- Worldly ID
- Facility
- Assessment ID
- total_energy_mj
- is_outlier_total_energy_mj
- total_ghg_kgco2e
- is_outlier_total_ghg_kgco2e
- total_finalProductAssembly_mj
- is_outlier_total_finalProductAssembly_mj
- finalProductAssembly_pcs
- finalProductAssembly_mj_intensity
- is_outlier_finalProductAssembly_mj_intensity
- total_finishedProductProcessing_mj
- is_outlier_total_fin_proc_mj
- finishedProductProcessing_pcs
- finishedProductProcessing_mj_intensity
- is_outlier_finishedProductProcessing_mj_intensity
- total_hardComponentTrimProduction_mj
- is_outlier_trim_prod_mj
- hardComponentTrimProduction_kg
- hardComponentTrimProduction_mj_intensity
- is_outlier_hardComponentTrimProduction_mj_intensity
- total_materialProduction_mj
- is_outlier_total_materialProduction_mj
- materialProduction_kg
- materialProduction_mj_intensity
- is_outlier_materialProduction_mj_intensity
- total_printingProductDyeingAndLaundering_mj
- is_outlier_print_dye_mj
- printingDyeingLaundering_kg
- printingDyeingLaundering_mj_intensity
- is_outlier_printingDyeingLaundering_mj_intensity
- total_rawMaterialProcessing_mj
- is_outlier_total_rawMaterialProcessing_mj
- rawMaterialProcessing_kg
- rawMaterialProcessing_mj_intensity
- is_outlier_rawMaterialProcessing_mj_intensity
- total_rawMaterialCollection_mj
- is_outlier_total_rawMaterialCollection_mj
- rawMaterialCollection_kg
- rawMaterialCollection_mj_intensity
- is_outlier_rawMaterialCollection_mj_intensity
- domestic_total_mj
- is_outlier_domestic_total_mj
Outlier Checks and What They Show
The outlier report shows which checks were flagged for each assessment. You can use this information to diagnose outlier issues and find solutions.
How Outlier Checks Work
The system tracks outliers for each facility type and assessment combination. If you report multiple facility types, the system checks the data for each facility type separately. This approach catches outliers more effectively because it compares similar facility types to one another.
What Happens When an Outlier Is Found
When the system identifies an outlier for a facility type, the entire facility is removed from your current results. To include flagged facilities in your dashboard, you can toggle the option to include outliers in the outlier modal.
The New Outlier CSV
The updated outlier report includes new columns with true or false values. These values indicate whether each check was flagged as an outlier.
Example of outlier detection columns

What kinds of automated data quality checks are available?
The Worldly platform automatically runs the following data checks during the facility self-assessment process.
Type
Finished Product Assembly Quantity
Validation
Yes
Yes
Yes
Biomass Source Mix
Validation
Yes
Yes
Yes
Steam Source Mix
Validation
Yes
Yes
Yes
Steam Vapor Check
Validation
Yes
Yes
Yes
District Heating Temperature Check
Validation
Yes
Yes
Yes
Vehicle Energy Sources
Validation
Yes
Yes
Yes
Low Total Energy
Validation
No
New in 2024
Yes
High Total Energy
Validation
No
New in 2024
Yes
High Total LNG
Validation
No
New in 2024
Yes
Reported rainwater use and harvesting answers do not match
Validation
Yes
Yes
Yes
Low Total Water Usage
Validation
No
No
New in 2025
High Total Water Usage
Validation
No
No
New in 2025
High Diesel Percentage
Outlier Detection
Yes
Yes
Yes
High LNG Percentage
Outlier Detection
Yes
Yes
Yes
Low Purchased Electricity Percentage
Outlier Detection
Yes
Removed
Removed
Low Energy per Number of Employees
Outlier Detection
Yes
Removed
Removed
Low Water per Number of Employees
Outlier Detection
Yes
Removed
Removed
High Wastewater
Outlier Detection
Yes
Yes
Yes
Ignore high user-entered custom emissions factors
Calculation
Yes
Yes
Yes
High Energy Usage
Outlier Detection
Individual Sources: The individual energy source (ex. coal) use is high in the context of energy totals.
Totals: The sum of all reported energy sources in a facility type is high.
No
Yes
Yes
High Water Usage
Outlier Detection
Individual Sources: The individual water source (ex. rainwater) use is high in the context of energy totals.
Totals: The sum of all reported water sources in a facility type is high.
No
Yes
Yes
High Normalized Energy Usage
Outlier Detection
No
Yes
Yes
High Normalized Water Usage
Outlier Detection
No
Yes
Yes
Significant Change in YOY Energy Usage
Outlier Detection
No
Yes
Yes
Significant Change in YOY Water Usage
Outlier Detection
No
Yes
Yes
Higg FEM Outlier Detection Methodology
To learn more about outlier detection, read Worldly's Higg FEM Outlier Detection Methodology.
Summary: A high-level overview of when outlier detection is triggered and what it means.
Definition of Data Outliers: What is the difference between an erroneous outlier vs a true outlier?
Initial Data Set: Cascale and Worldly used the complete set of FEM23 assessments to establish outlier thresholds for use with FEM24 assessments.
Approach to Identifying Outliers: Learn how a standard statistical method, the Interquartile Range, is used to identify outliers.
Single Year-on-Year (YoY) Change: Read about how the YoY comparison flags anomalously large values and what went into the development of this feature.
Total Energy/Water Outlier Thresholds: View these two tables to understand the threshold values for Energy and Water outliers.
What can I expect with Outlier Detection?
Outlier detection was released on Feb. 19, 2025. If a facility’s Higg FEM assessment was posted before that date, the facility will need to wait until after this date to be able to take advantage of data checking.
In addition, as long as they have not begun verifying data with a verification body and it is before April 30, 2025, facilities can un-post their assessment to use data check to look for outliers in their responses before reposting their assessment.
For example, if a facility posted their assessment on January 31, 2025, they will need to do the following between February 19 and April 30, 2025:
- Un-post their assessment
- Use outlier detection to check their assessment data
- Repost their assessment
Year-over-year anomaly detection will also be available in mid-March.
What is considered an Outlier?
- Erroneous outliers are data points that arise from errors during data collection, recording, calculation, or entry. They represent inaccuracies and do not reflect true underlying patterns in the data. For example, a typographical error that records a person’s age as 250 years instead of 25 would be an erroneous outlier, as it does not correspond to a realistic value. Similarly, recording an energy value in the wrong units without conversion (e.g., a value in megajoules, MJ, assigned units of kilowatt-hours, kWh) also leads to erroneous outliers. Such “bad data” must be identified and addressed – typically by removal or correction (e.g., via verification or replacement with imputed values) – to maintain the integrity of the analysis.
- True outliers are legitimate data points that are statistically rare but not erroneous. They occur naturally in the data and reflect real phenomena or occurrences. True outliers often provide valuable information about unusual but valid behaviors or events. For example, an anomalous increase in facility energy use might correspond to increased cooling implemented during a heat wave. True outliers can reveal critical trends, risks, or opportunities and should not be dismissed without analysis.
FDM to FEM Outlier Detection
Both FEM and FEM require outlier detection before posting.
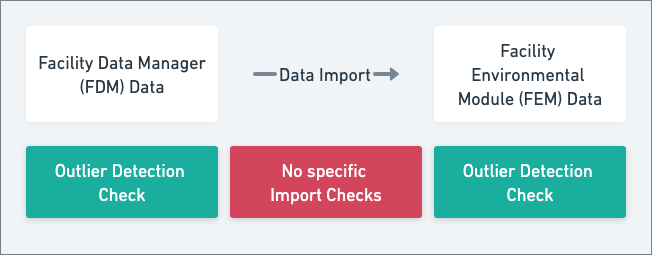
Please note that although FDM data imported to FEM is not checked during the transfer, FEM runs outlier detection on the imported data before the assessment is posted.
FAQ
A Higg FEM user has identified data that looks incorrect. What should they do?
If a user or the Worldly team finds inaccurate data that has made it all the way through to final outputs from Higg FEM 2023, the user should report these issues directly to their Cascale member manager and Worldly Support.
The process for correcting FEM responses after verification has been completed is outlined in more detail in the FEM Verification Protocol, section 4.10. It is critical that the facility be engaged and willing to participate in this process, and it must be initiated by the facility.
Here is how to start the process, from the Protocol:
- 4.10.3 Currently, VRF Changes are only permitted for confirmed inaccuracies in Quantitative Data (e.g., energy or water use data, quantitative data related to GHG emissions calculations, wastewater volume, or waste quantities, etc.)
- 4.10.4 To initiate the VRF Change Request Process, the facility shall contact the VPM at FEM@Sumerra.com with their request and provide details of the inaccuracy, corrected value as well as the reason the facility did not identify the inaccuracy and use the VRE process before finalizing their module.
To ensure data coming in through Higg FEM 2024 is high quality, customers should focus on:
1. Guiding their facility partners to leverage all of the available resources and guidance available to them, including e-learning, question-level guidance, and translation/language selection.
2. Using FDM to capture quantitative data throughout the year, both to detect data quality issues sooner and to streamline filling in of the Higg FEM at the end of the year.
3. Double-checking quantitative data prior to submission to ASC, especially if after April 30 2025 when facilities are no longer able to un-post once submitted.
4. Reviewing quantitative data again after verification is complete, prior to finalizing and posting to VRF.
How do the anomaly detection checks appear within the assessment?
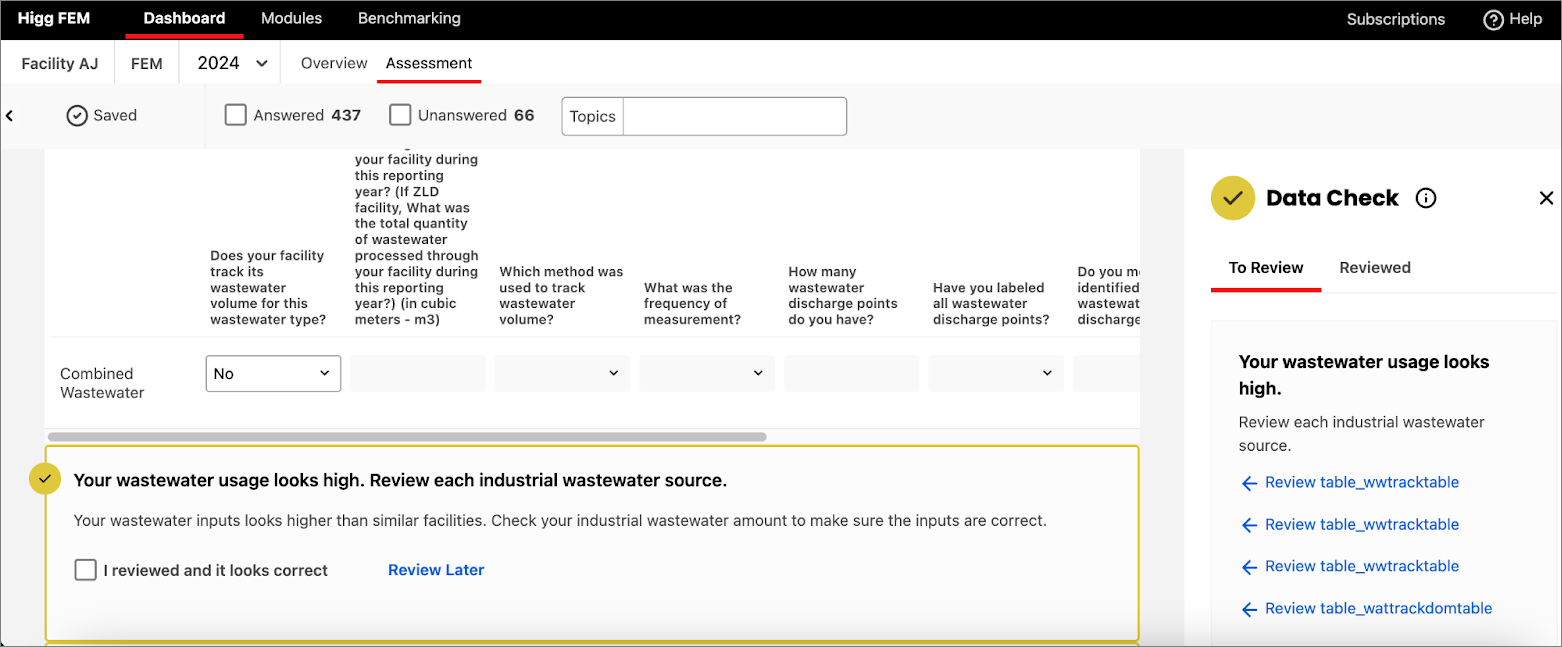
These checks that detect anomalies ask users to either update their values. They are able to post with these values if they review them and comment on why the value is accurate. Validations that fully prevent posting will appear in red underneath the value flagged.
What do I do with Outlier Data?
We recommend following up with the relevant facilities to request them to confirm the data.