
Table of Contents
- Network
- Accessing Supplier Profiles
- How to use filters in the Network
- How to Access Hidden Columns
- Bulk Tagging Accounts
- Module Share Notifications
- Example
The Network tab is used to create, name, and save a list of factories based on an applied filter criteria.
To get started, navigate to Supply Chain from the top navigation bar. Select Network from the dropdown menu.
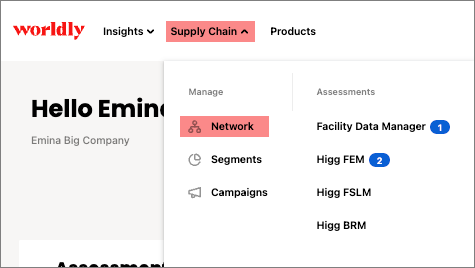
Network
On the Network table, users can create and name a custom filter based on defined attributes. They can also save this custom filter to a catalog of other saved filters that can be accessed at any time. These saved filters are referred to as segments.
To create a new segment, apply at least one filter and click Save as Segment within the filters column.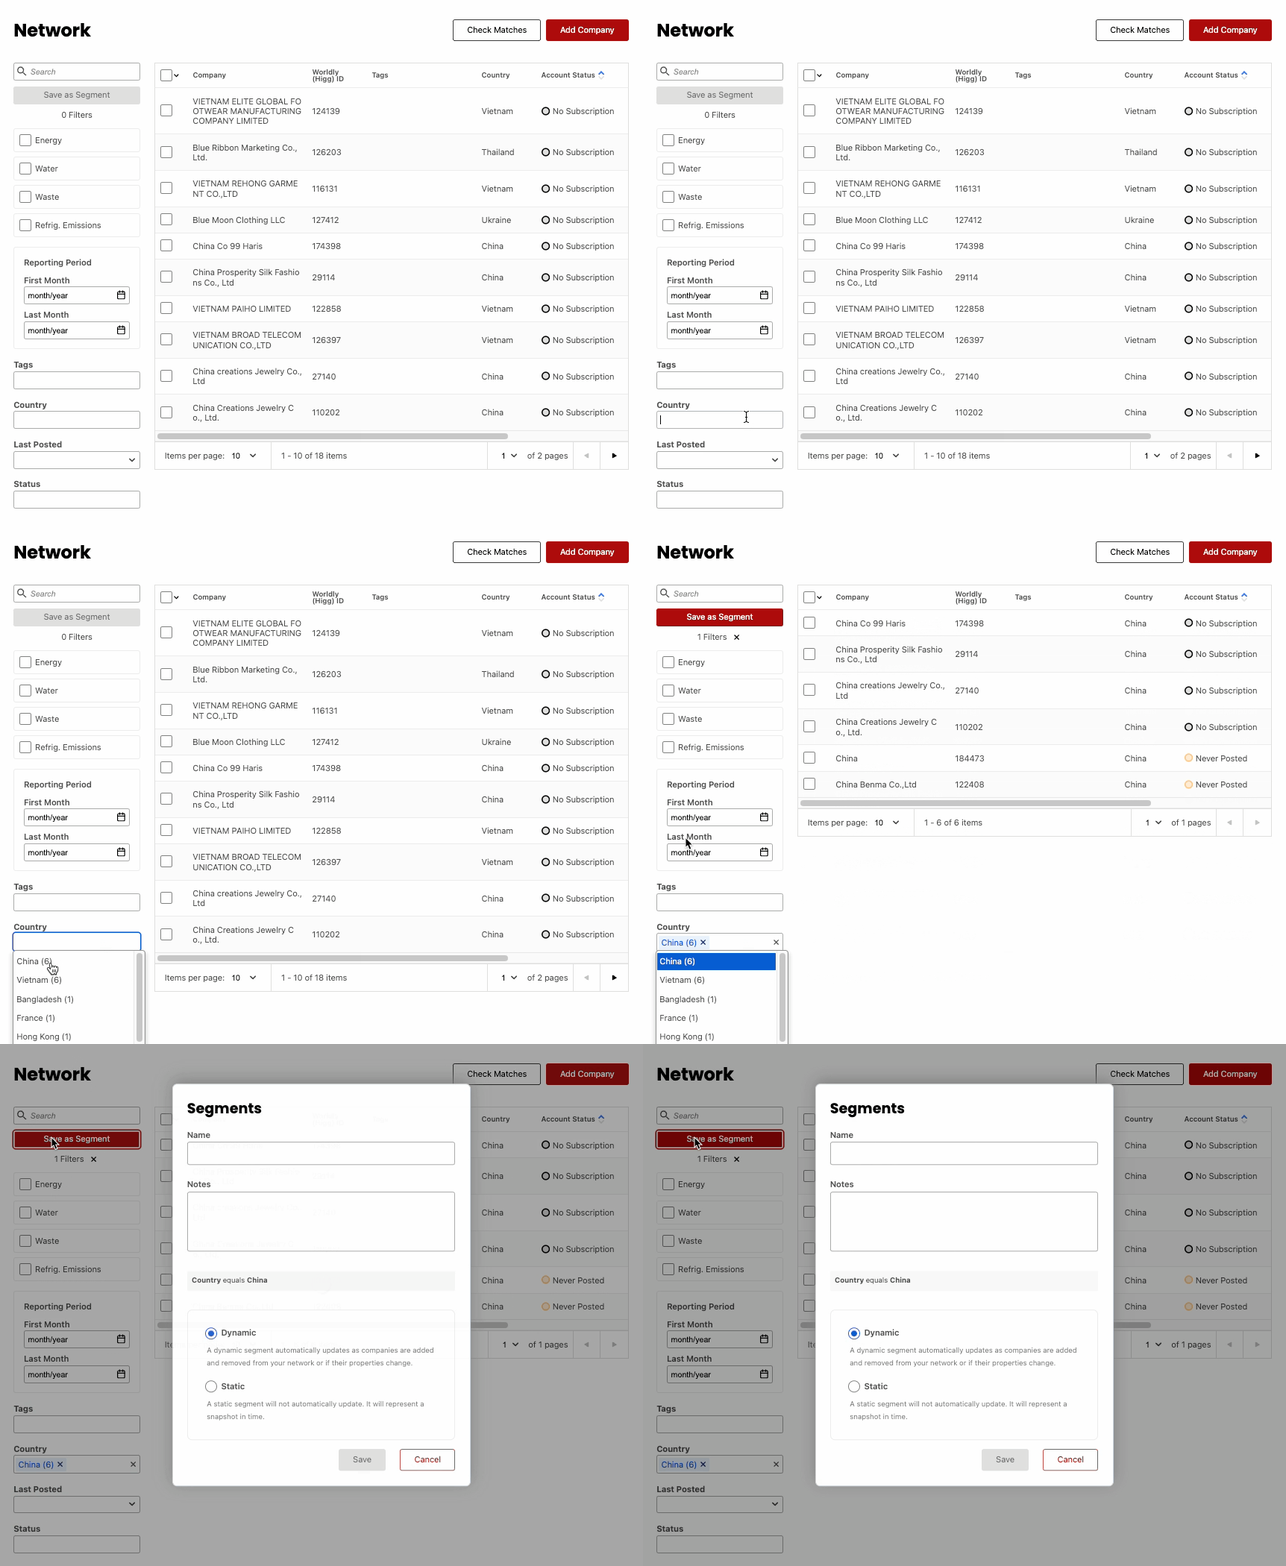
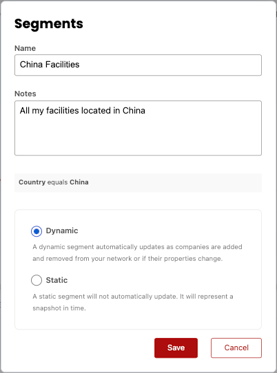
Enter in the Name and any Notes associated with this segment.
Next, you can indicate whether this is a Dynamic or Static Segment. When saved, this will display a list of factories that align with the type of segment.
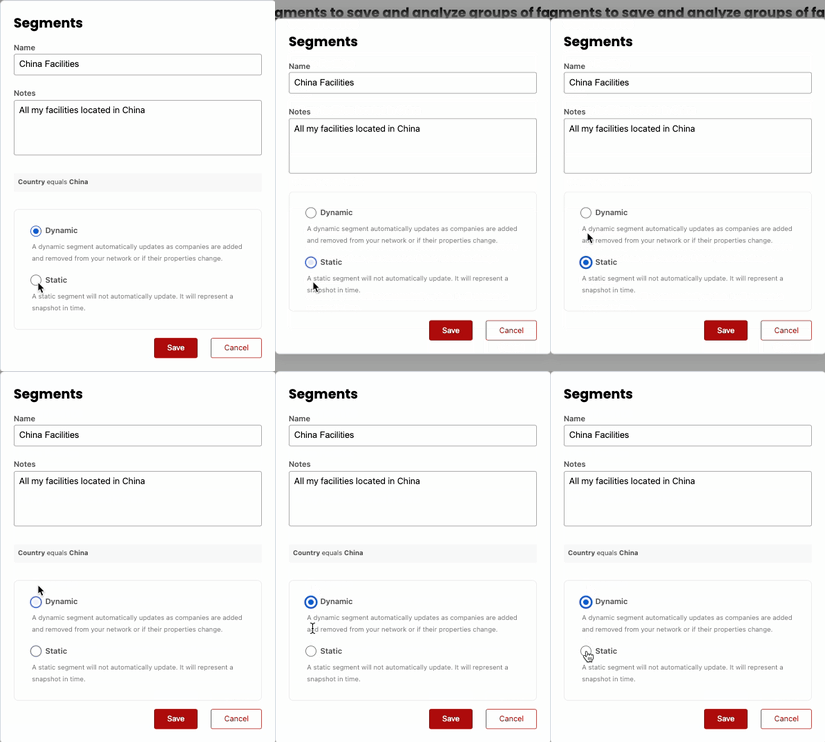
Dynamic Segment
A segment that moves factories in or out of the filter based on the criteria being met.
EX: If a brand wants to see who in the factory network is a Tier 1 facility, they can tag facilities with “Tier 1” and the dynamic segment will update with any facility with that tag.
1. Creating a Dynamic Segment that tracks the “Tier 1” tag.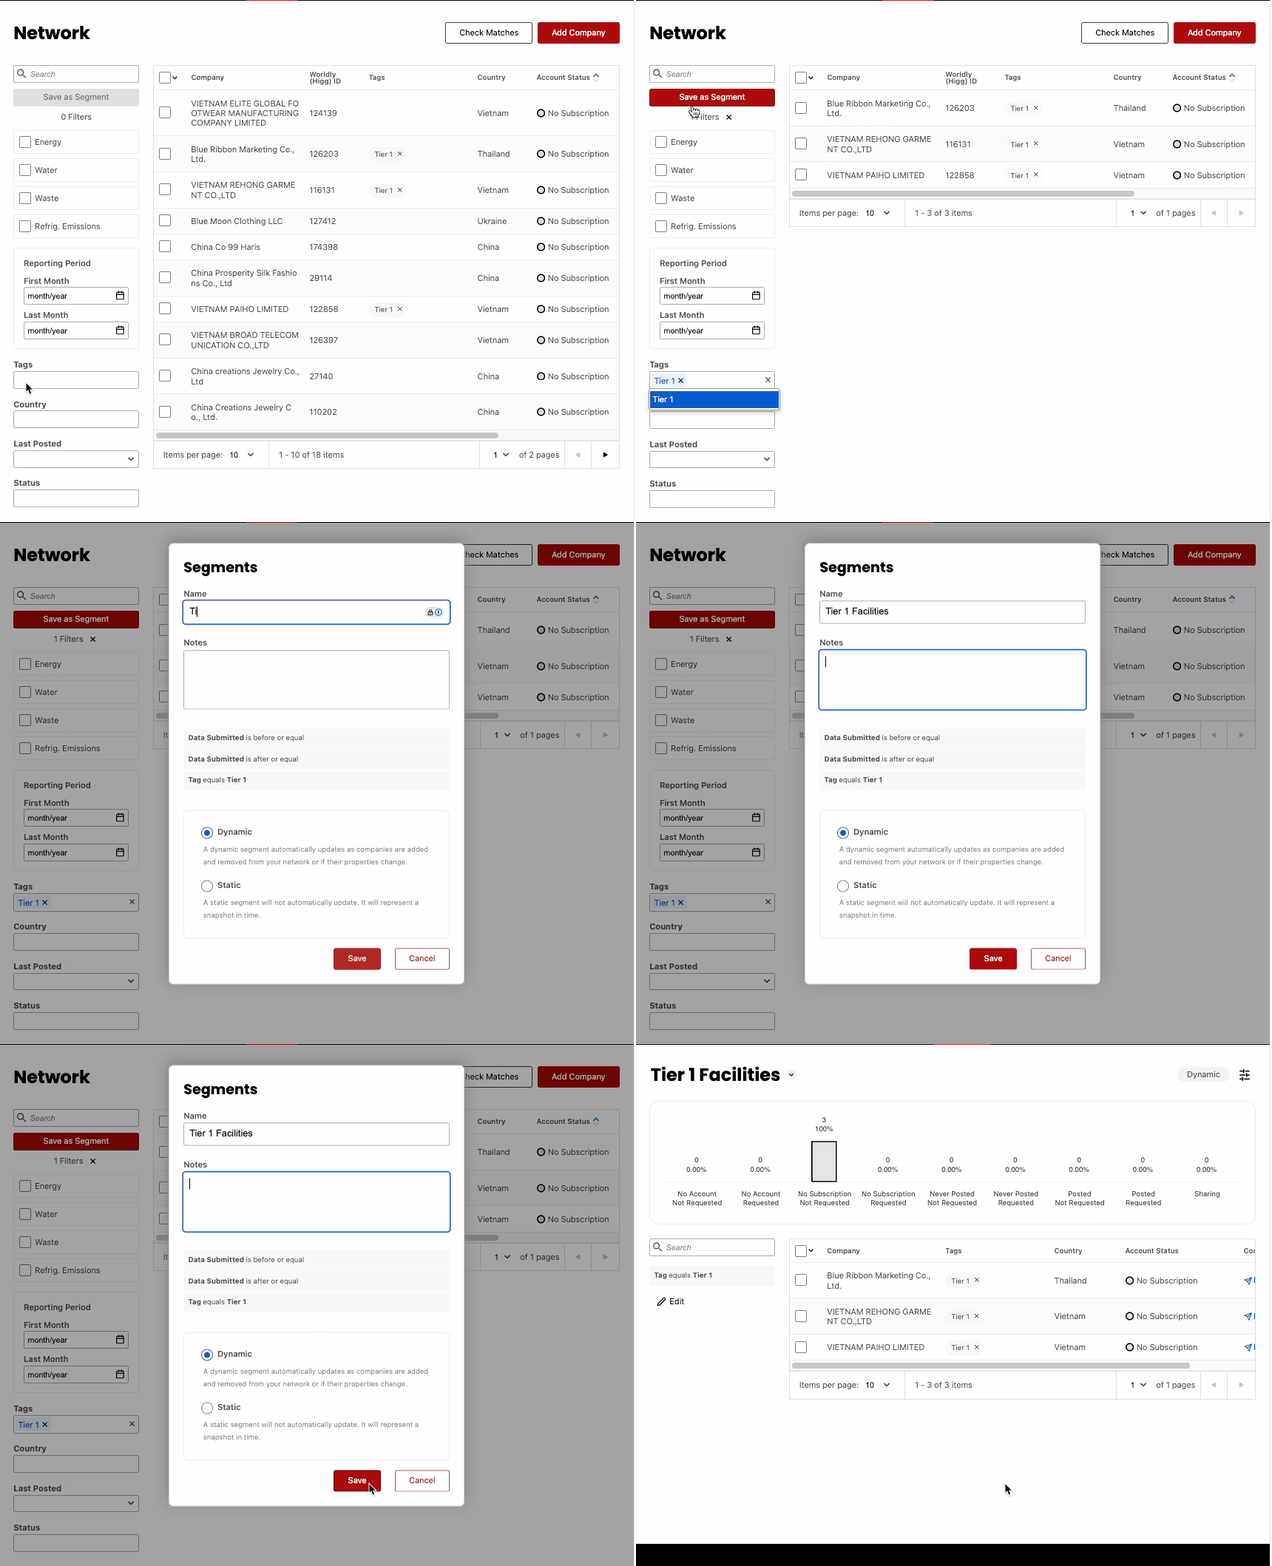
2. Adding “Tier 1” tag to more facilities: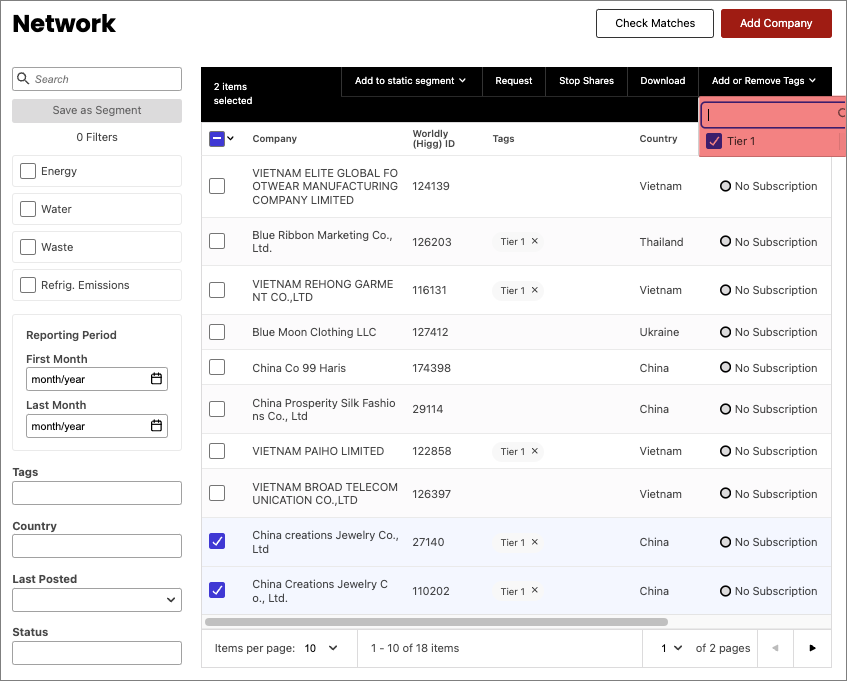
3. Dynamic List is updated with 2 more facilities: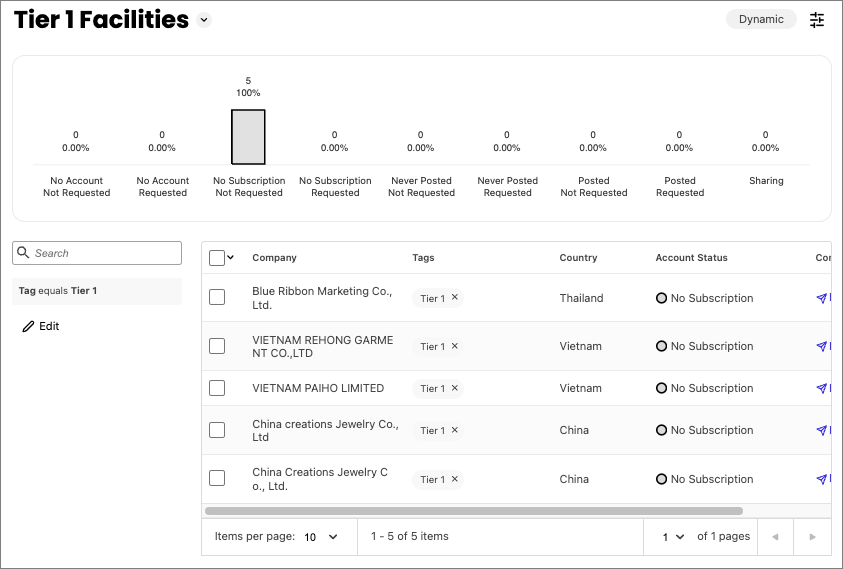
Static Segment
A segment that creates a fixed list of factories that meet a criteria in a moment in time.
EX: If a brand wants to create a segment of 5 VIP facilities to send a monthly newsletter, the static segment will create a list that will stay the same.
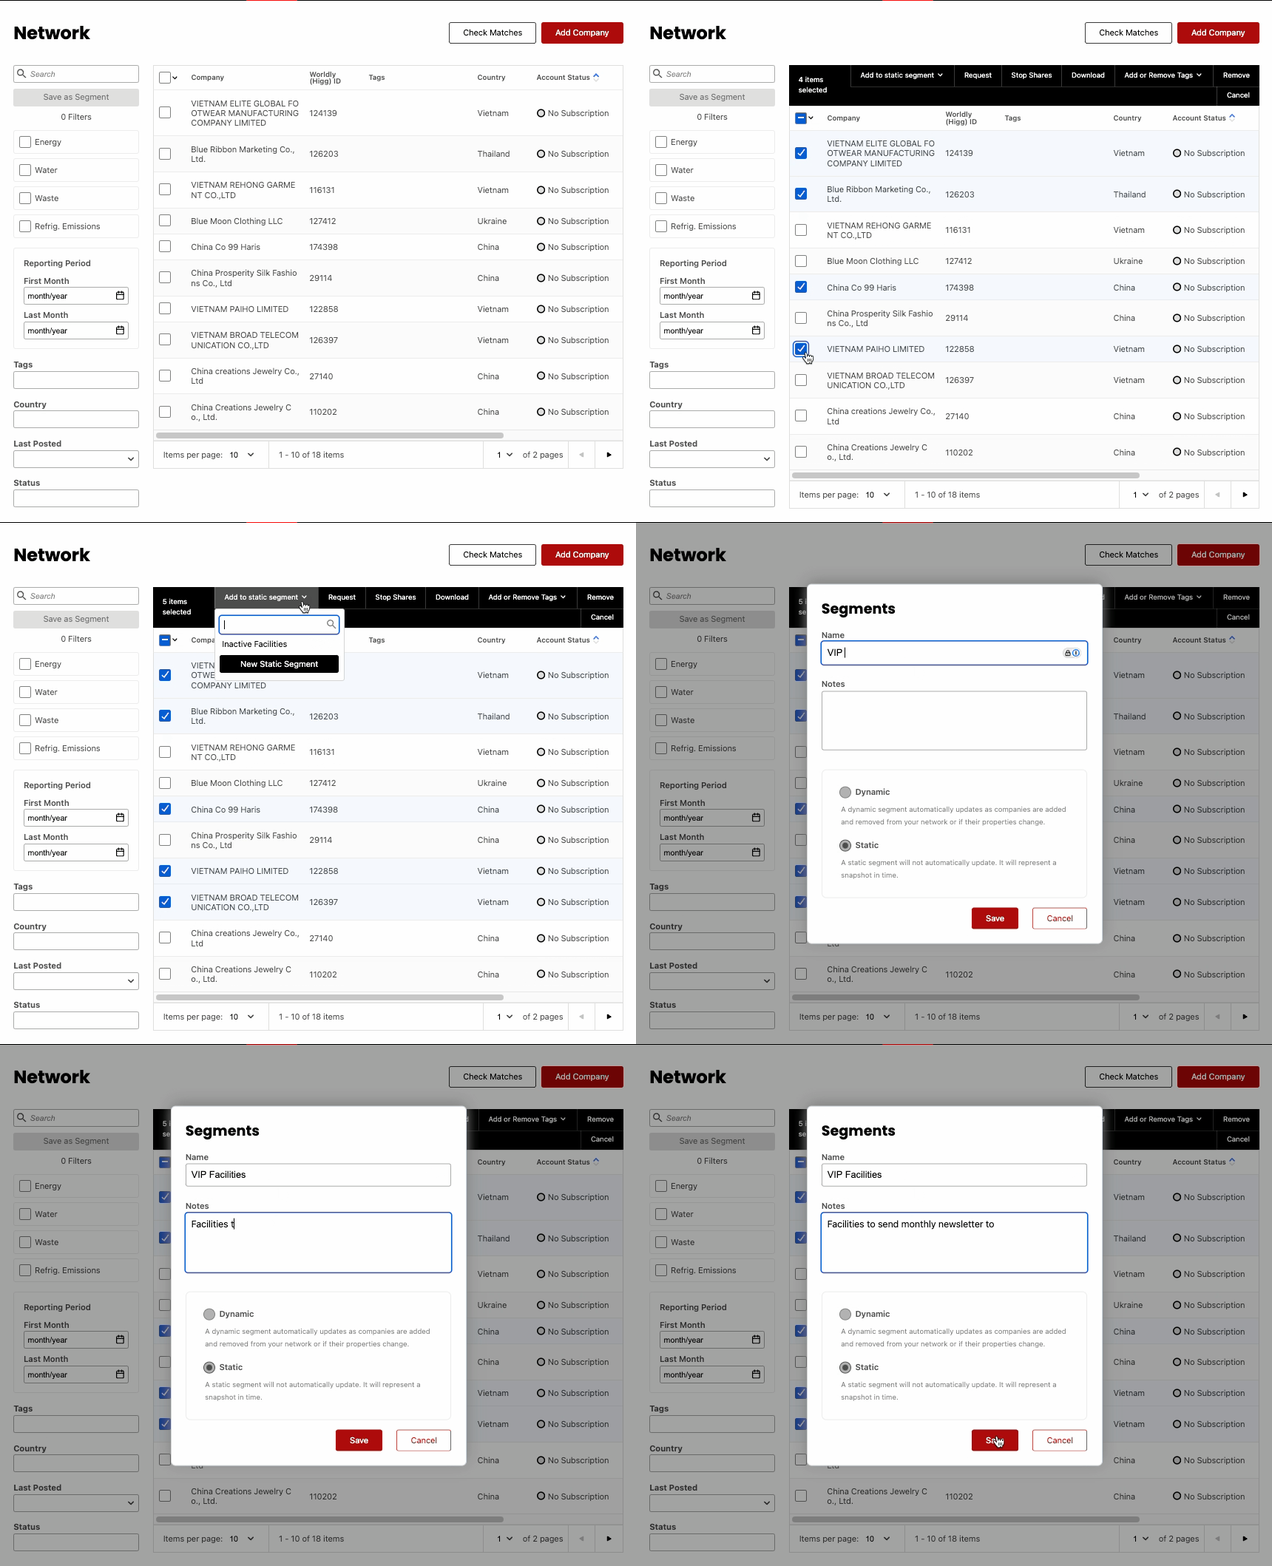
Static segments can either be created by saving an unfiltered list of facilities (like in the VIP Facility List example above), or you can apply any filter(s) and save as a static segment.
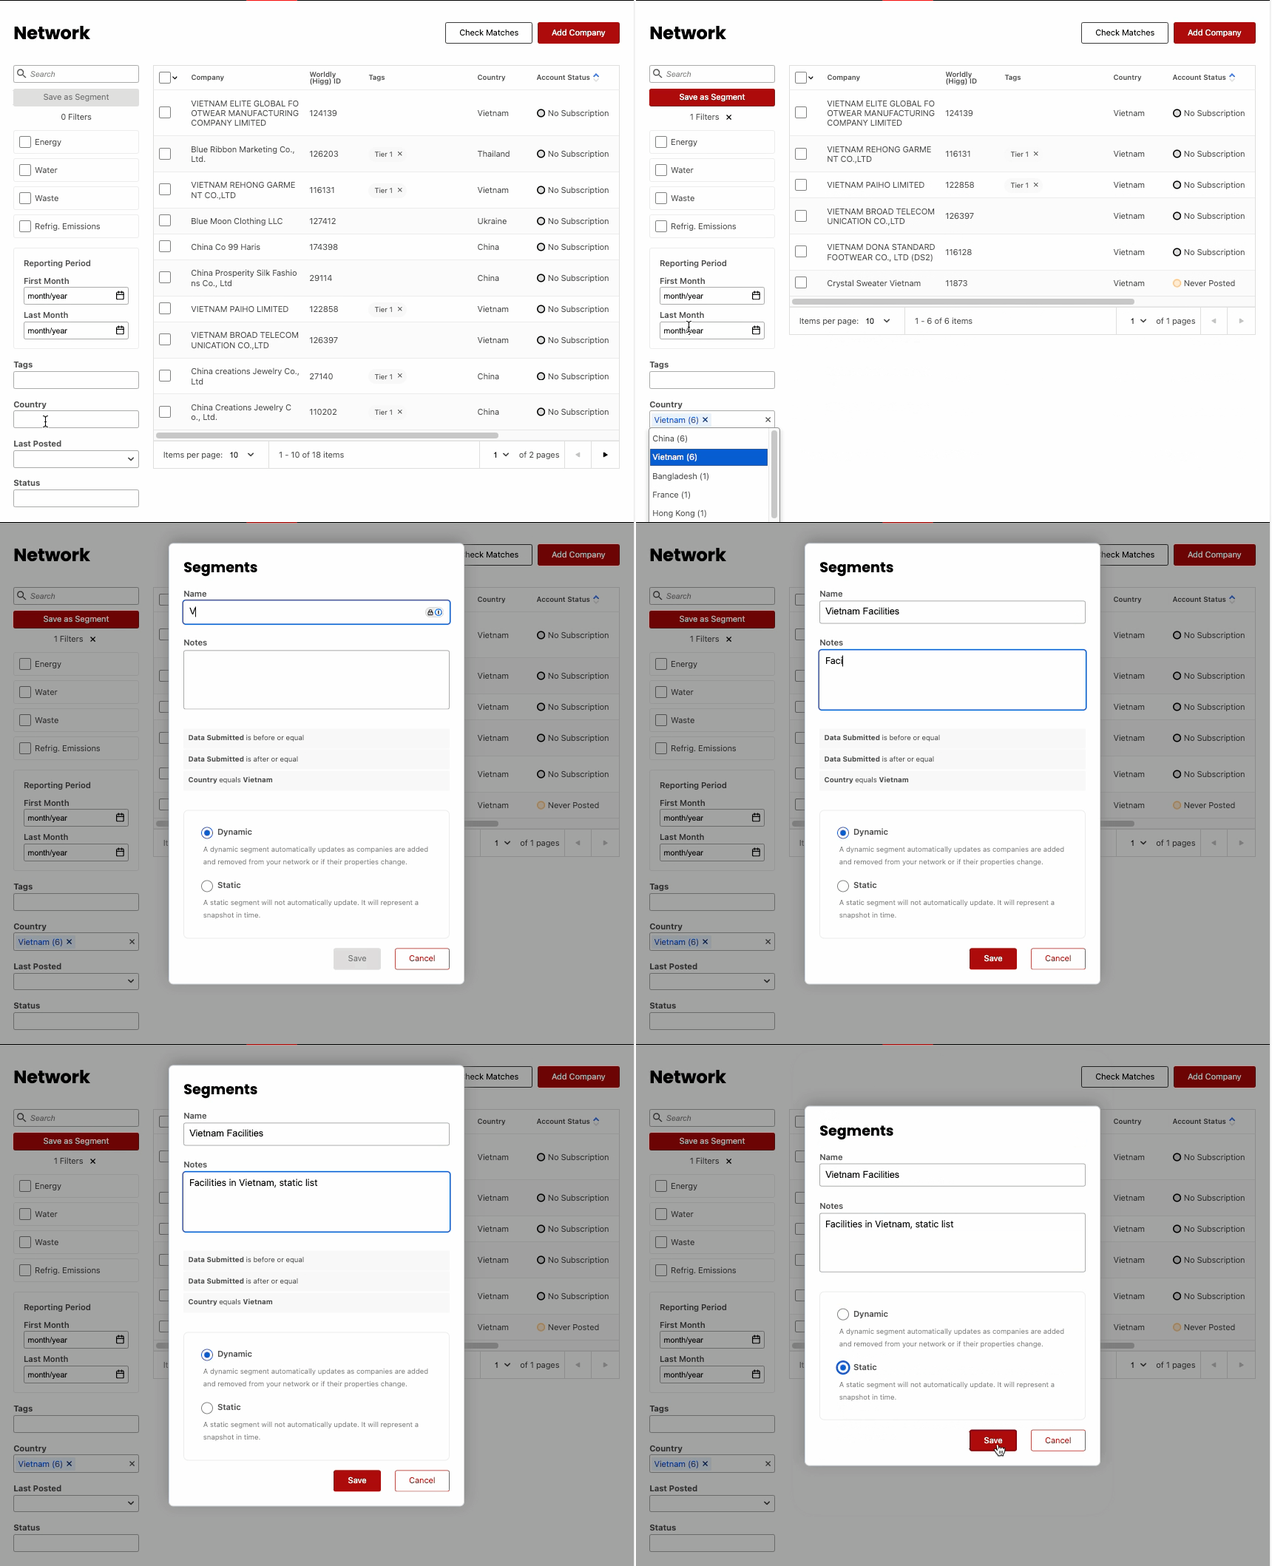
Additionally, you can manually add a facility to a static segment by:
- Selecting at least one facility from the Network tab
- Clicking “Add to static segment”.
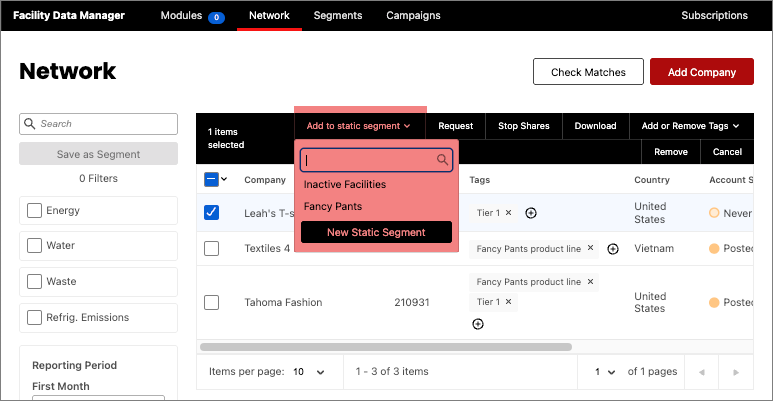
Click here to read more about adding and removing facilities.
If your Network table is empty, click here to learn more about bulk uploading to the Worldly Collaboration Suite.
Accessing Supplier Profiles
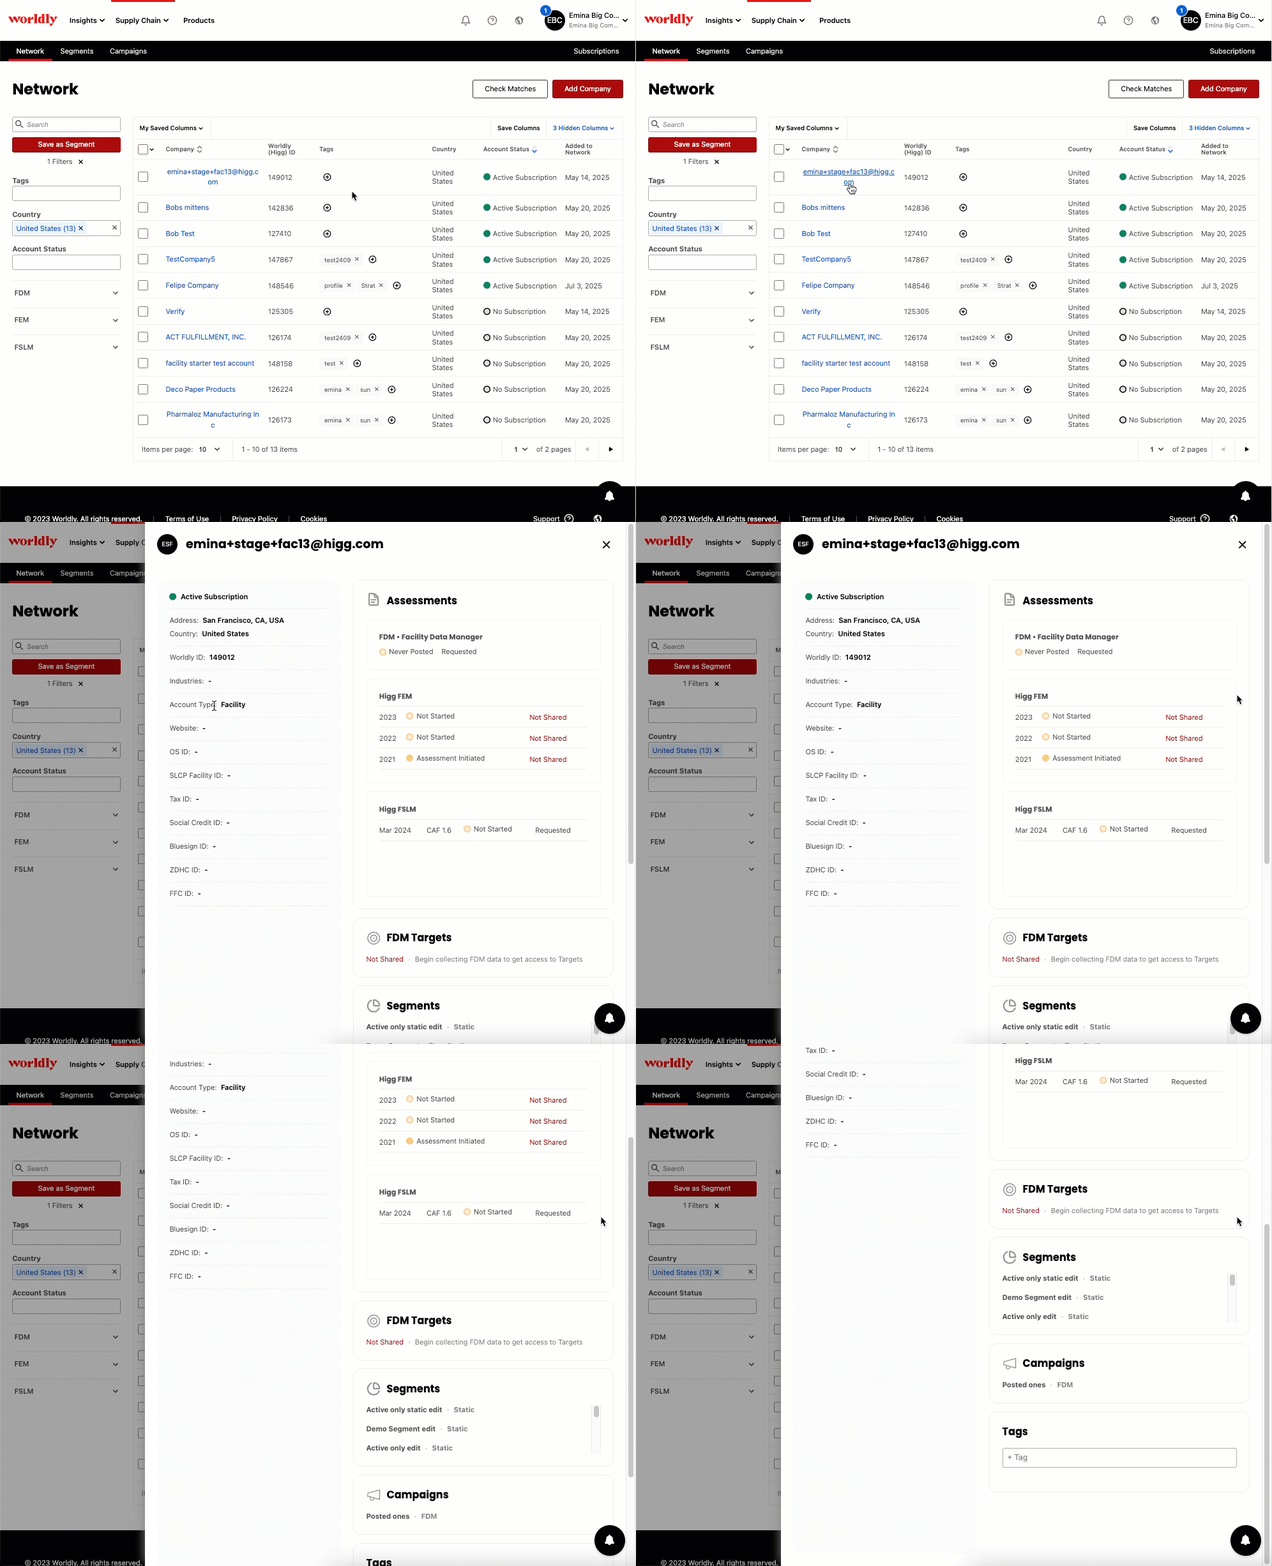
To access a supplier profile, click on the company row to open the drawer.
Account Profile Information
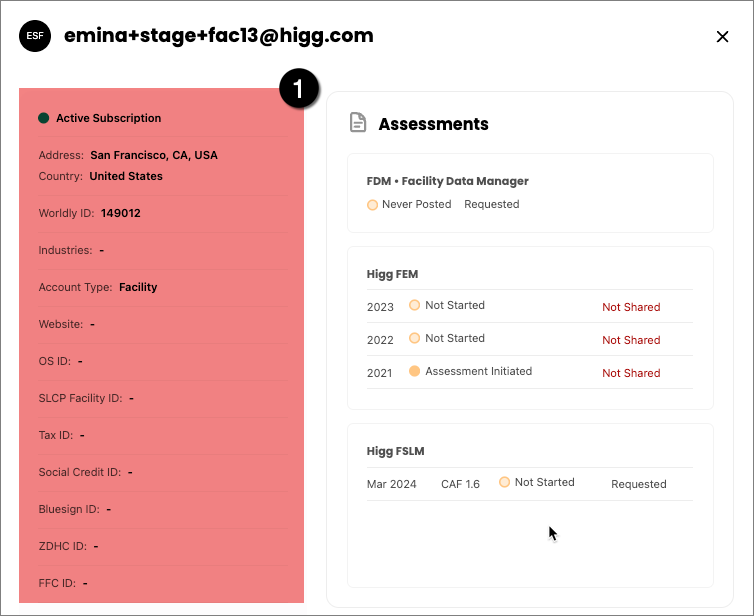
- Review a list of account profile information for the facility.
This includes the Subscription Type, Address, Country, Worldly ID, Industry, Account Type, Website, OS ID, SLCP Facility ID, Tax ID, Social Credit ID, Bluesign ID, ZDHC ID, and FFC ID.
Assessments
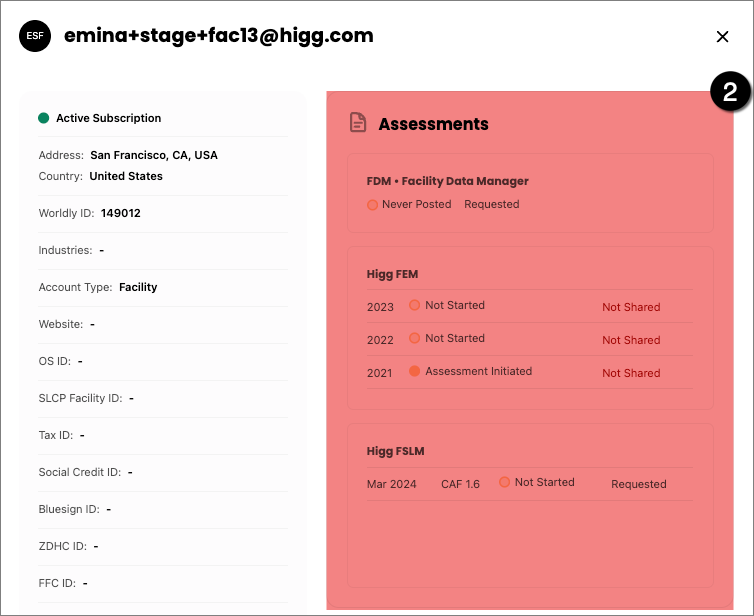
2. View which assessments the facility has completed, as well as the assessment date, status of the assessment, and the share status.
FDM Targets, Segments, Campaigns, and Tags
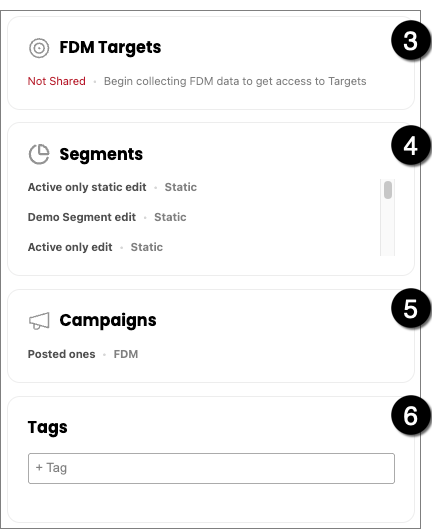
3. View the FDM Targets available for each facility
4. View the segments you've added this facility to
5. View the campaigns you've added this facility to
6. View any added tags to this account, or add additional tags to this facility. Tags are account-level in the network.
How to use filters
Single filters
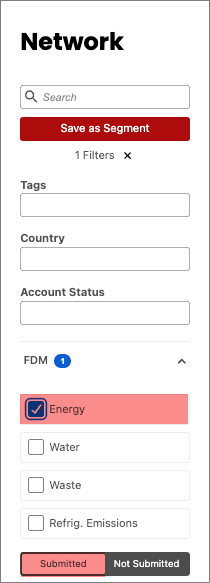
- Reporting Section Filter Submitted = Facilities who have submitted that section (i.e. energy) at any point in time
-
EX: This filters to show all facilities who have submitted energy data for FDM.
Example
-
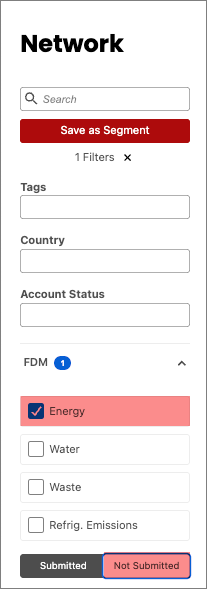
- Reporting Section Filter Not Submitted = Facilities who have not submitted that section (i.e. energy) at any point in time
-
EX: This filters to show all facilities who have NOT submitted energy data for FDM.
Example
-
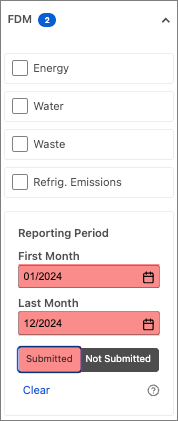
- Reporting Period Filter Submitted = Facilities who have submitted data for all months within the defined dates.
-
EX: This filters to show all facilities who have submitted data for every month in 2024. In other words, only facilities who have submitted 12 months of data for 2024 will be shown in the table.
Example
-
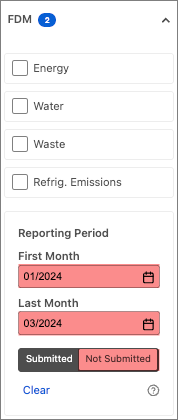
- Reporting Period Filter Not Submitted = Facilities who have not submitted data for all months within the defined dates
-
EX: This filters to show all facilities who have NOT submitted data in the first quarter of 2024. In other words, only facilities who have submitted data for January, February, and March 2024 will be shown in the table.
Example
-
Combo filters
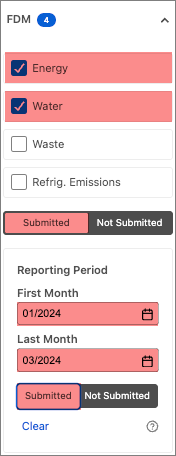
- Reporting Section & Period Submitted = Facilities who have submitted that section (i.e. energy and water) for all months within the defined dates
-
EX: This filters to show all facilities who have submitted energy and water data for January, February, and March 2024. In other words, all energy and water data has been submitted for Q1 of 2024.
Example
-
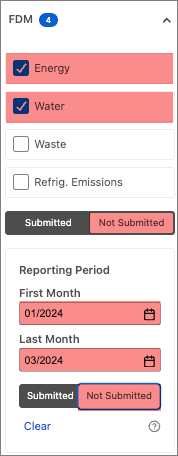
- Reporting Section & Period Not Submitted = Facilities who have not submitted that section (i.e. energy and water) for all months within the defined dates
-
EX: This filters to show all facilities who have not submitted energy and water data for January, February, and March 2024. In other words, no energy and water data has been submitted for Q1 of 2024.
Example
-
Opposing combo filters
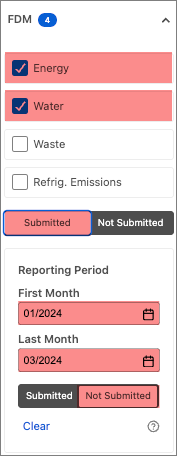
- Reporting Section Submitted + Reporting Period Not Submitted = Facilities who have submitted that section but not for all months within the defined dates
- EX: This filters to show all facilities who have submitted energy and water data, but not for all months in Q1 of 2024. Some examples could include:
- A facility that has submitted energy and water data for January and March of 2024, but not for February 2024
-
A facility that has submitted energy and water data for just January 2024, but not for February or March 2024.
Example
- EX: This filters to show all facilities who have submitted energy and water data, but not for all months in Q1 of 2024. Some examples could include:
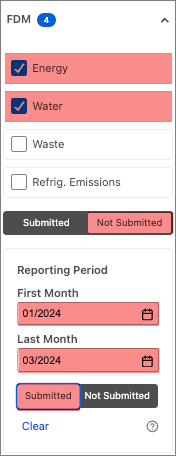
- Reporting Section Not Submitted + Reporting Period Submitted = Facilities who have not submitted that section but have submitted other sections for all months within the defined dates
- EX: This filters to show all facilities who have not submitted energy and water data, but have submitted the other sections for Q1 of 2024. Some examples could include:
- A facility that has submitted waste data for January, February, and March 2024.
-
A facility that has submitted refrigerated emissions for Q1 2024.
Example
- EX: This filters to show all facilities who have not submitted energy and water data, but have submitted the other sections for Q1 of 2024. Some examples could include:
Additional notes
- When using the Reporting Section filter, only facilities who have an active subscription will be displayed in the results. Any facility in a No Account or No Subscription status will not be displayed and will need to be filtered for separately.
- When using the Reporting Period filter, only facilities who have a history of posting data will be displayed in the results. Any facility in a No Account, No Subscription or Never Posted status will not be displayed and will need to be filtered for separately.
How to access Hidden Columns
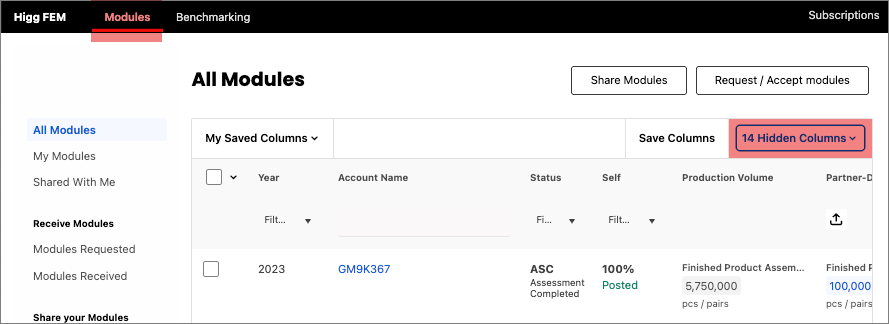
If you don't see a column in the All Modules table, follow these directions to access hidden columns:
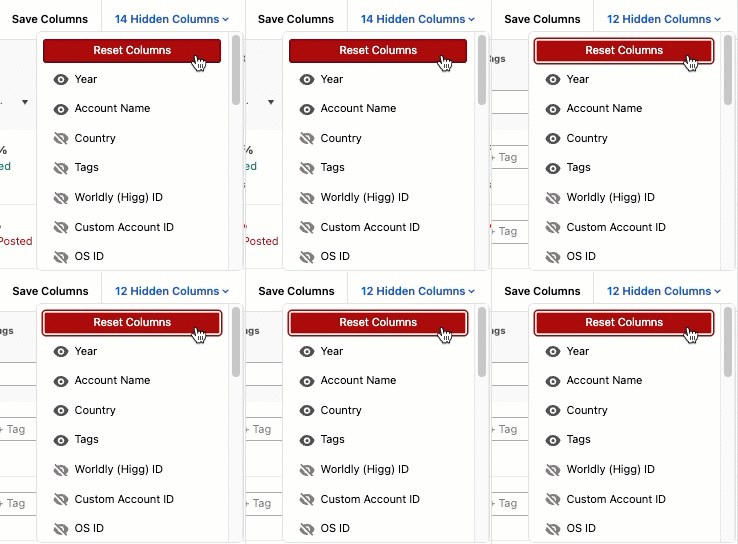
- On the Modules tab, click on the upper right corner of the All Modules table.
- In the drop down menu, use the toggle to hide/show each column.
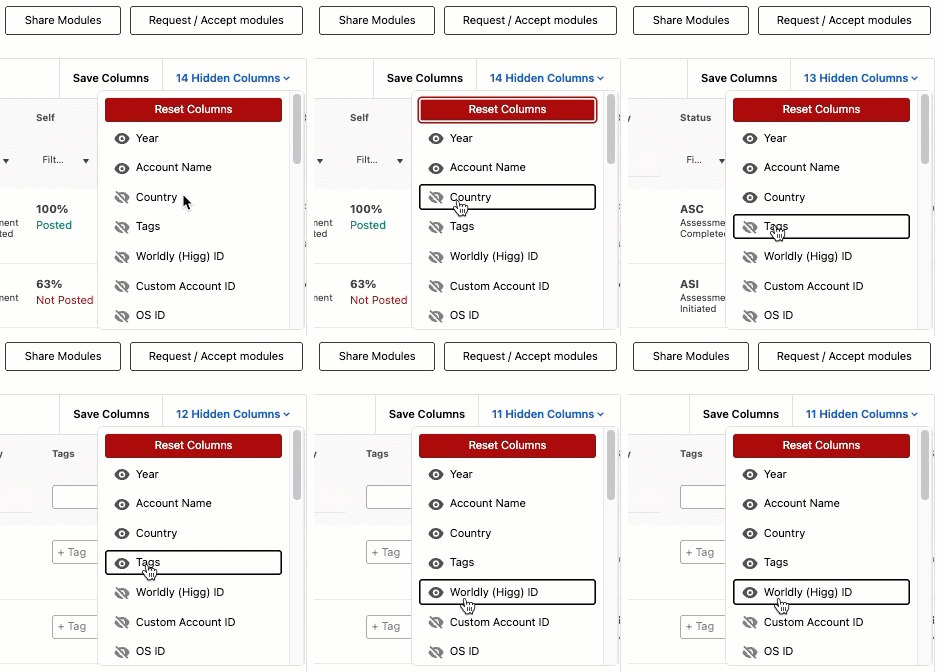
- Click Reset Columns to return to the standard view of the table. (i.e. 12 columns are hidden)
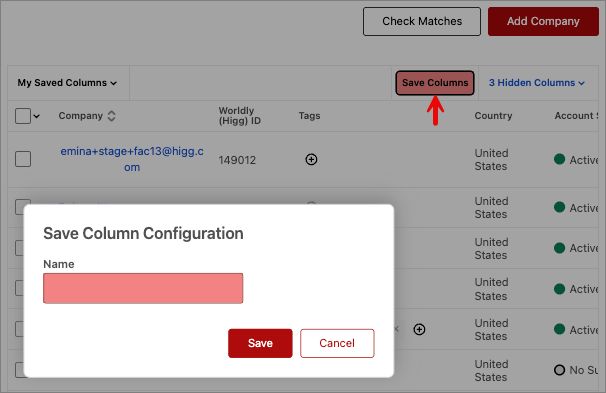
- Select Save Columns to save a specific column configuration.
Bulk Tagging Accounts
Apply tags to accounts in bulk:
- In the table:
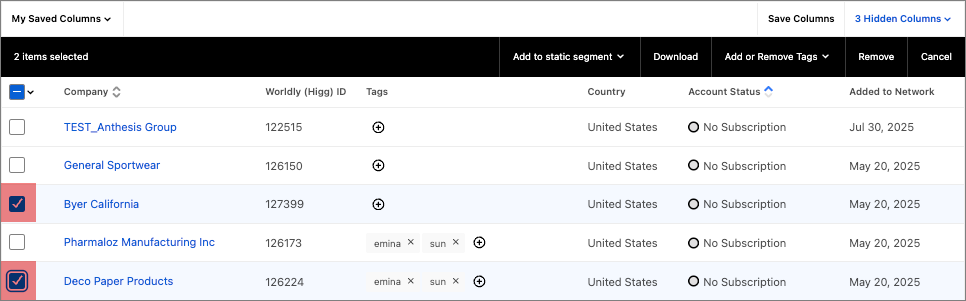
- Select the check boxes next to the applicable facilities.
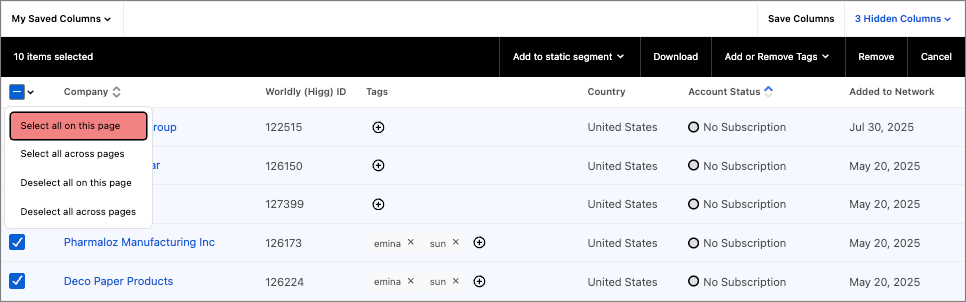
- Bulk select facilities by clicking the upper left check box to Select all on this page.
- Select the check boxes next to the applicable facilities.
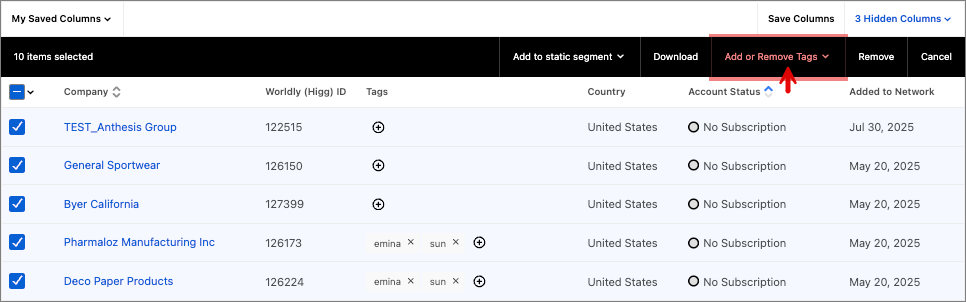
- Once the desired facilities are selected, select Add or Remove Tags.
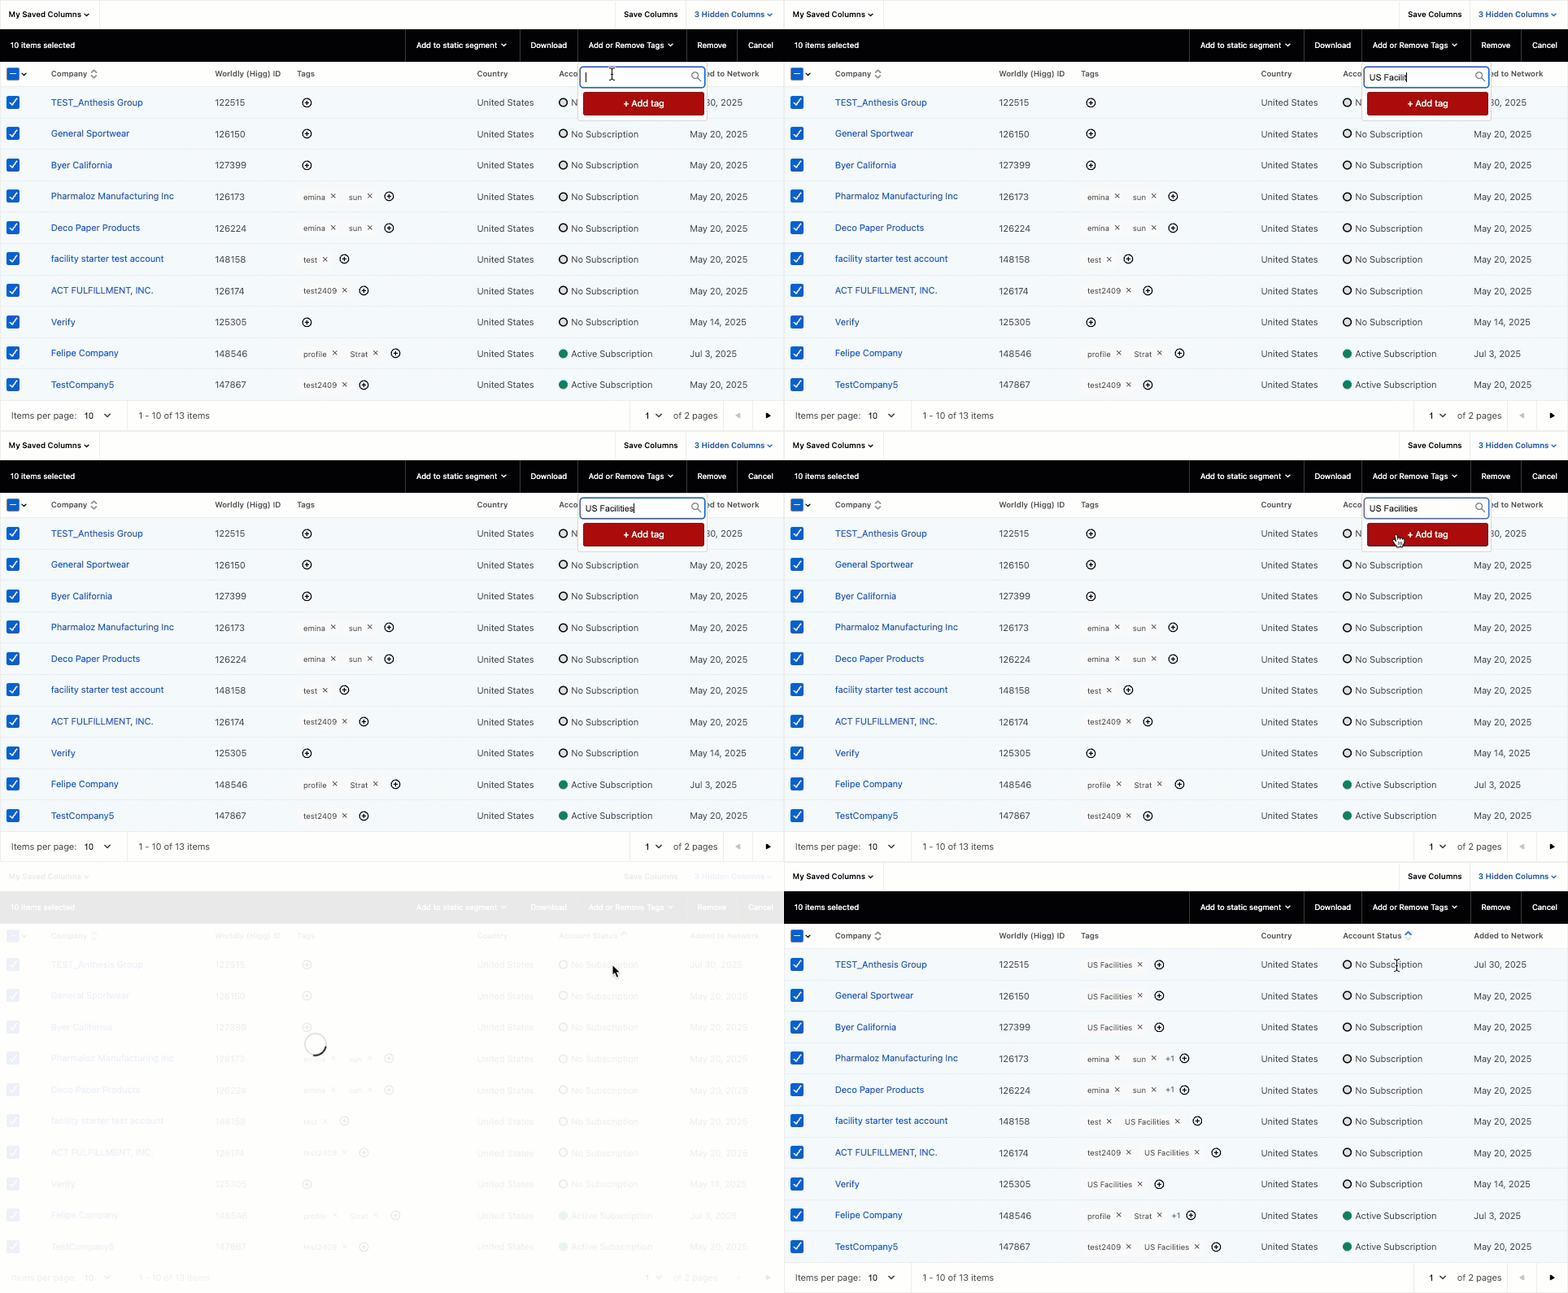
- In this example, since the table is filtered to show all facilities in the United States, we'll add the US Facilities tag. Enter in the tag and select +Add Tag.
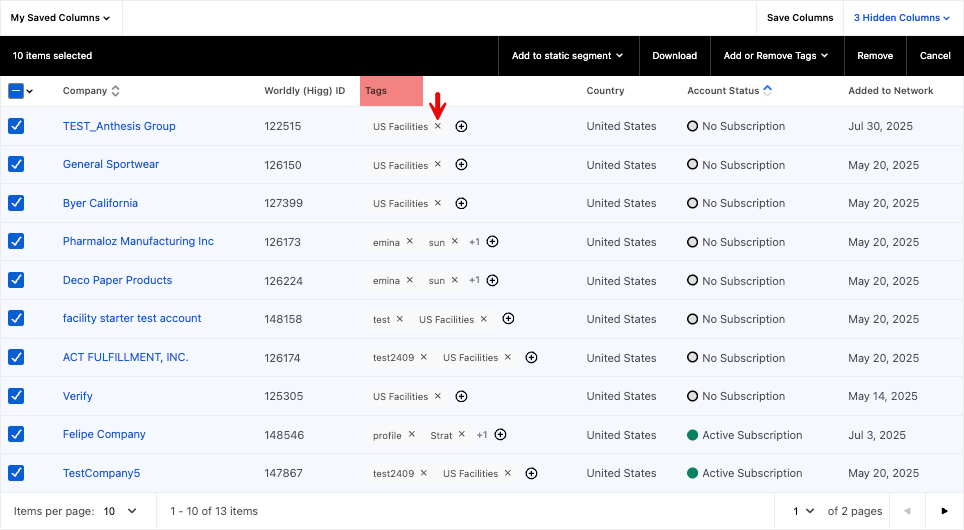
- In the Tags column, you can remove tags one by one by selecting the X icon next to the tag.
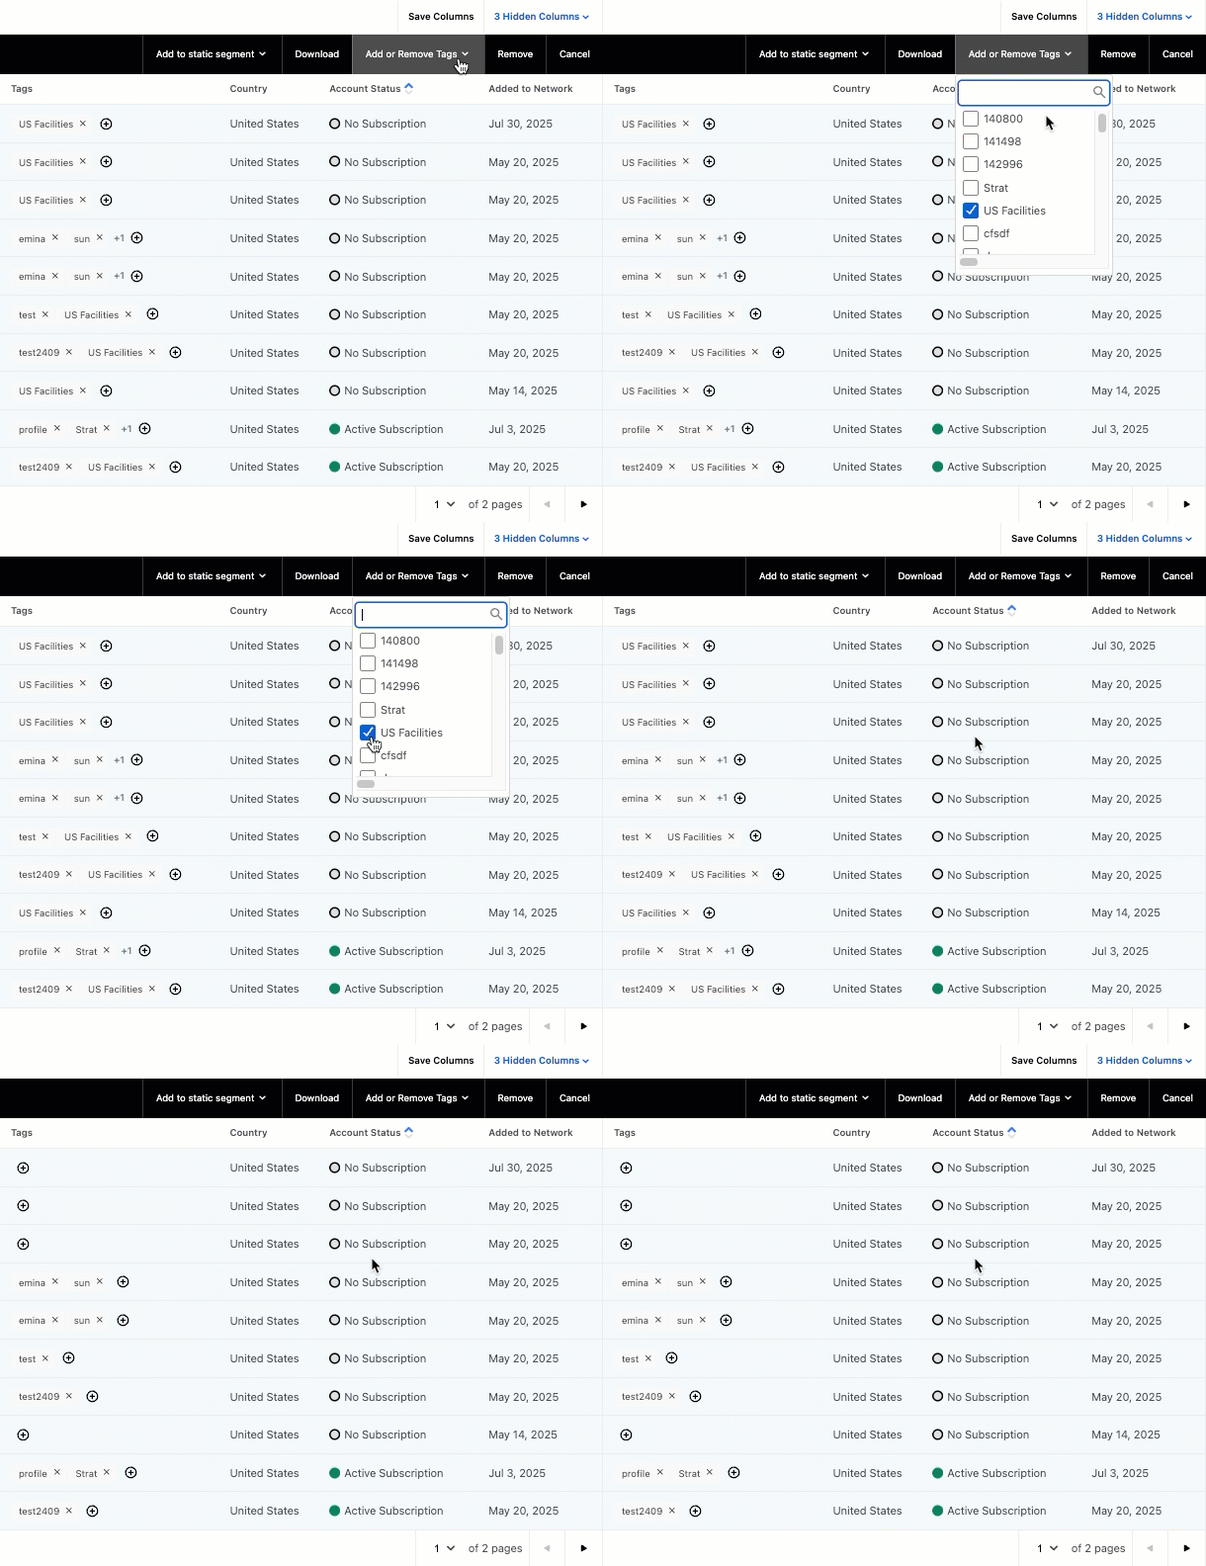
- You can also bulk remove tags using the Add or Remove Tags button found in step 2.
Module Share Notifications
Module share requests are automatically sent to facilities when emails are enabled in campaigns. There are two locations where you'll see module share notifications: the Supply Chain dropdown and section headers.
If you see blue notification bubbles next to an assessment type, this means:
- There are modules that are shared with you that you haven't been accepted yet
- There are requests to share your module that you haven't yet approved
Supply Chain Dropdown
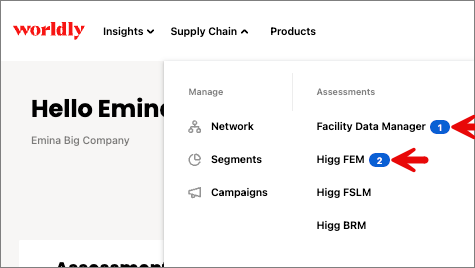
Clicking on the blue notification bubble will bring you to the appropriate Modules table.
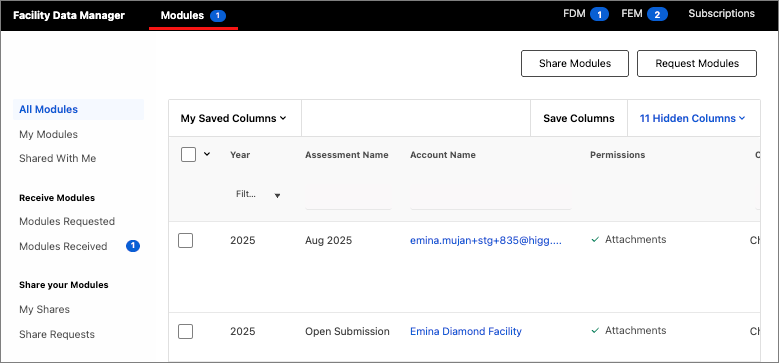
Section Headers
If you have blue notification bubbles in the Supply Chain dropdown, these will be mirrored in the Network, Segments, and Campaigns section headers.

Clicking on the blue notification bubble in the section header opens a pop up to review shares of that assessment type.
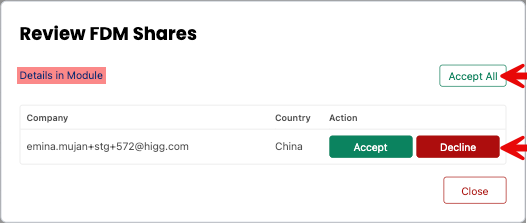
- Select Accept All to bulk accept.
- Select Accept/Decline to review each share individually.
- Select Details in Module if you want to view the request in the corresponding Modules table.
Example
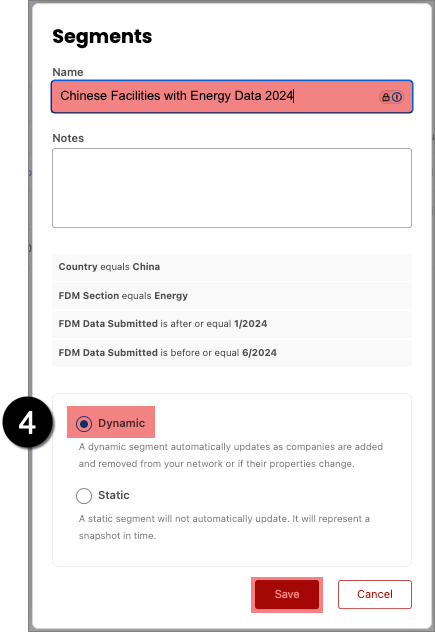
Let’s say you create a segment that has the following qualities:
- Only Chinese facilities
- Data has been submitted for the Energy section of FDM
- Reporting period is 01/2024 to 06/2024
- Dynamic segment
Expand to view Example
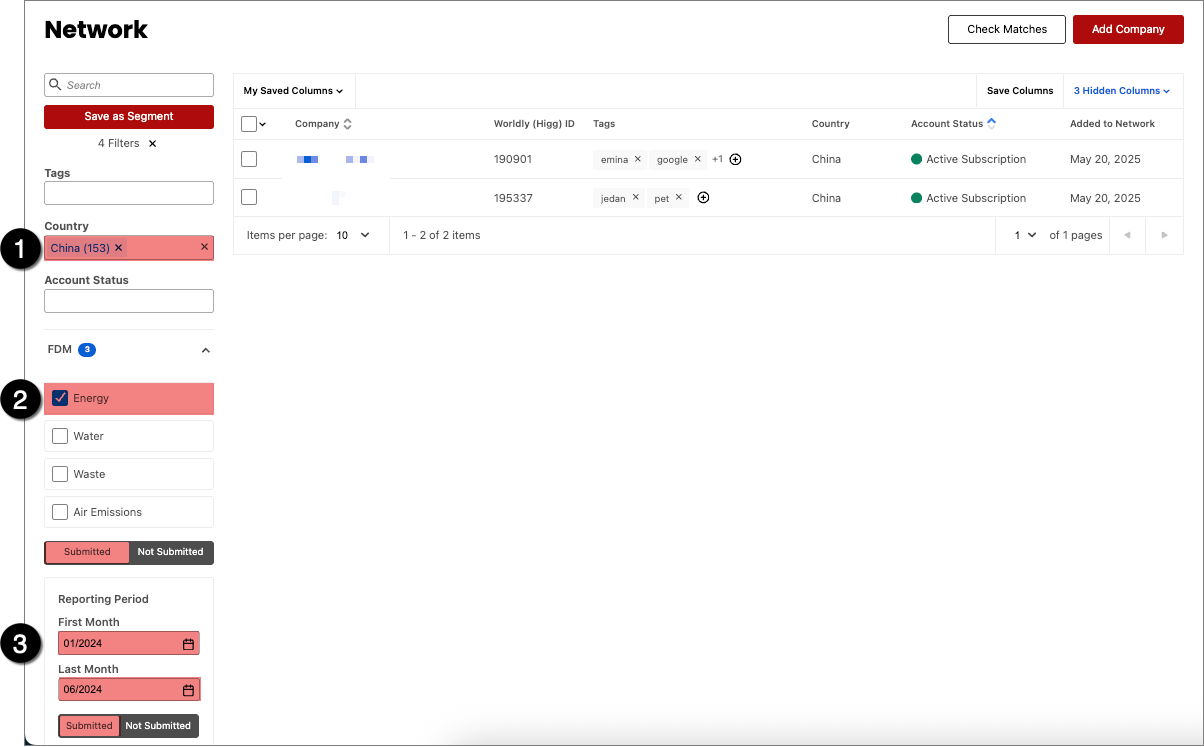
After your segment is created, click +Campaign
Next, select the desired assessment for the campaign. In this case, we'll select FDM.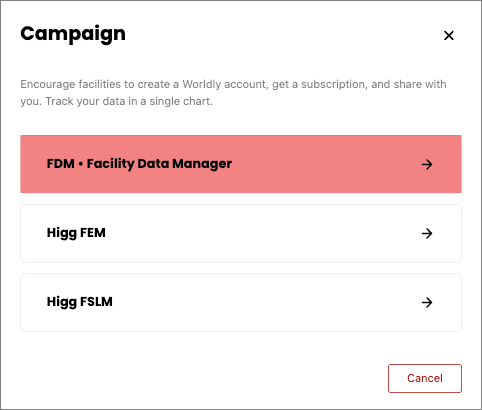
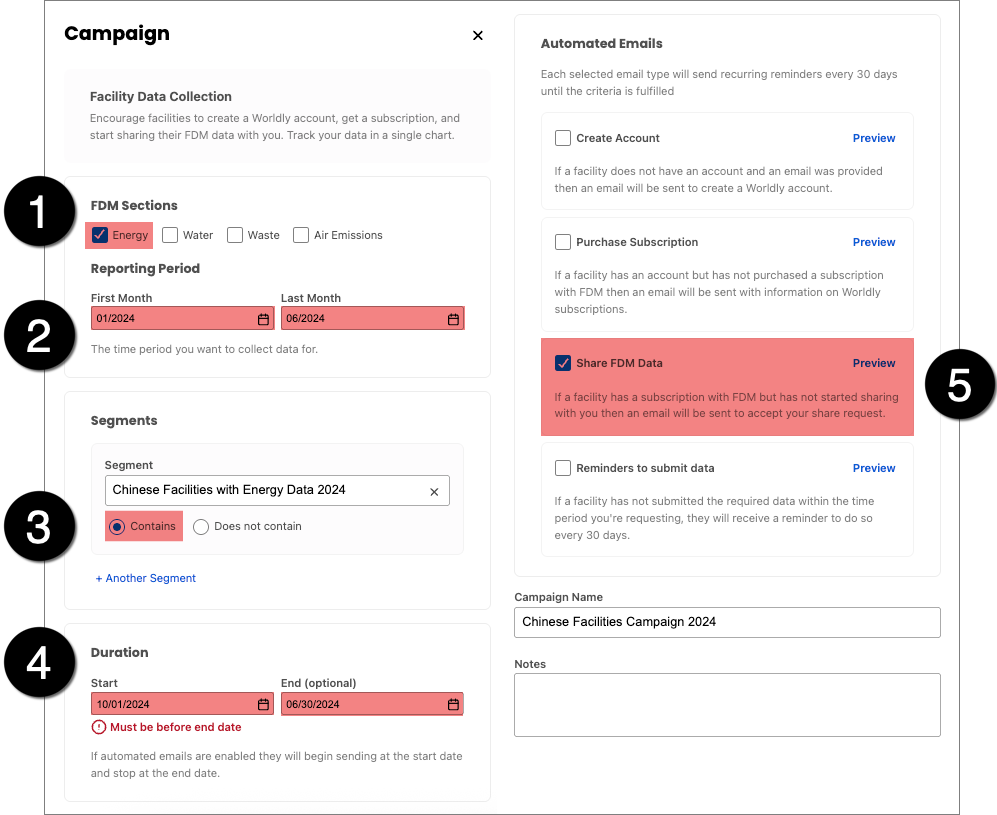
Enter in the following details into the campaign form.
- Collecting FDM Energy data
- The reporting period (or time period the energy data occurred) is from January 2024 to June 2024
- The campaign contains the segment created above
- The duration of the campaign is for Q4 of 2024 (October, November, December 2024)
- The email requests facilities to share FDM data
Who receives this email?
If ABC Clothing Facility is targeted within this campaign and submits energy data for Q1 and Q2 of 2024 (January, February, March, April, May, and June 2024), they will still receive this email due to the fact that they belong to the Segment we created above.
In other words, even though ABC Clothing Facility:
- ✅ Has submitted requested energy data,
- ✅ During the requested reporting period (Q1 and Q2 of 2024),
- ✅ And effectively fulfilled the requirements of the campaign,
ABC Clothing Facility will still be included in the campaign (and receive emails from the campaign) since the emails are sent based on whether a facility is included in the segment.
Bottom Line: Emails are sent based on the criteria used to create segments, as opposed to the criteria used to create a campaign.