
Table of Contents
Navigation
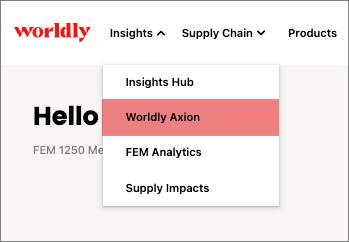
- Navigate to Insights and select Worldly Axion.
- This takes you to the Worldly Axion Overview page.
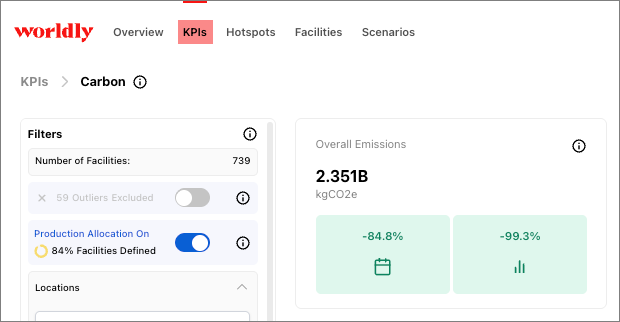
Select the KPI tab.
KPI Dashboard Overview
The KPI dashboard provides a high-level overview of Key Performance Indicators (KPIs) associated with an Risk Area.
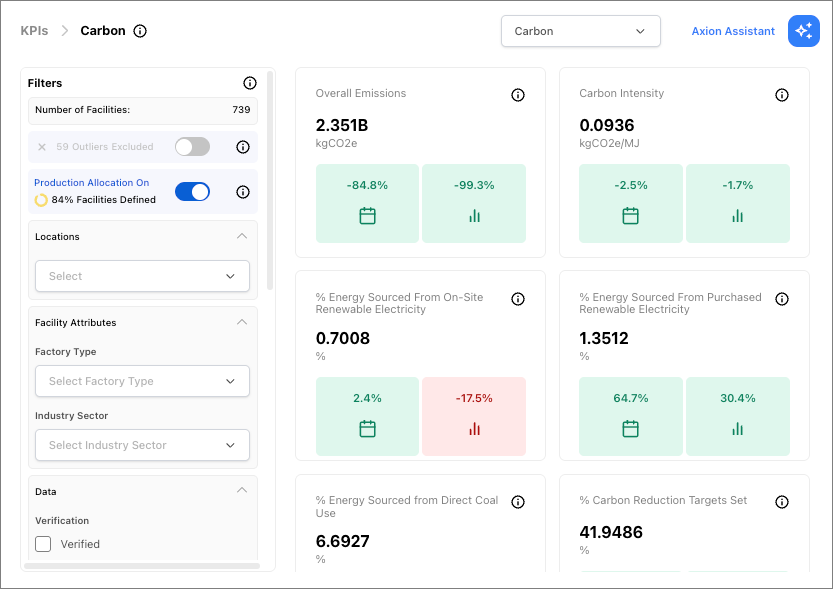
KPI cards are located at the top of the page, which can be further refined by using the filters.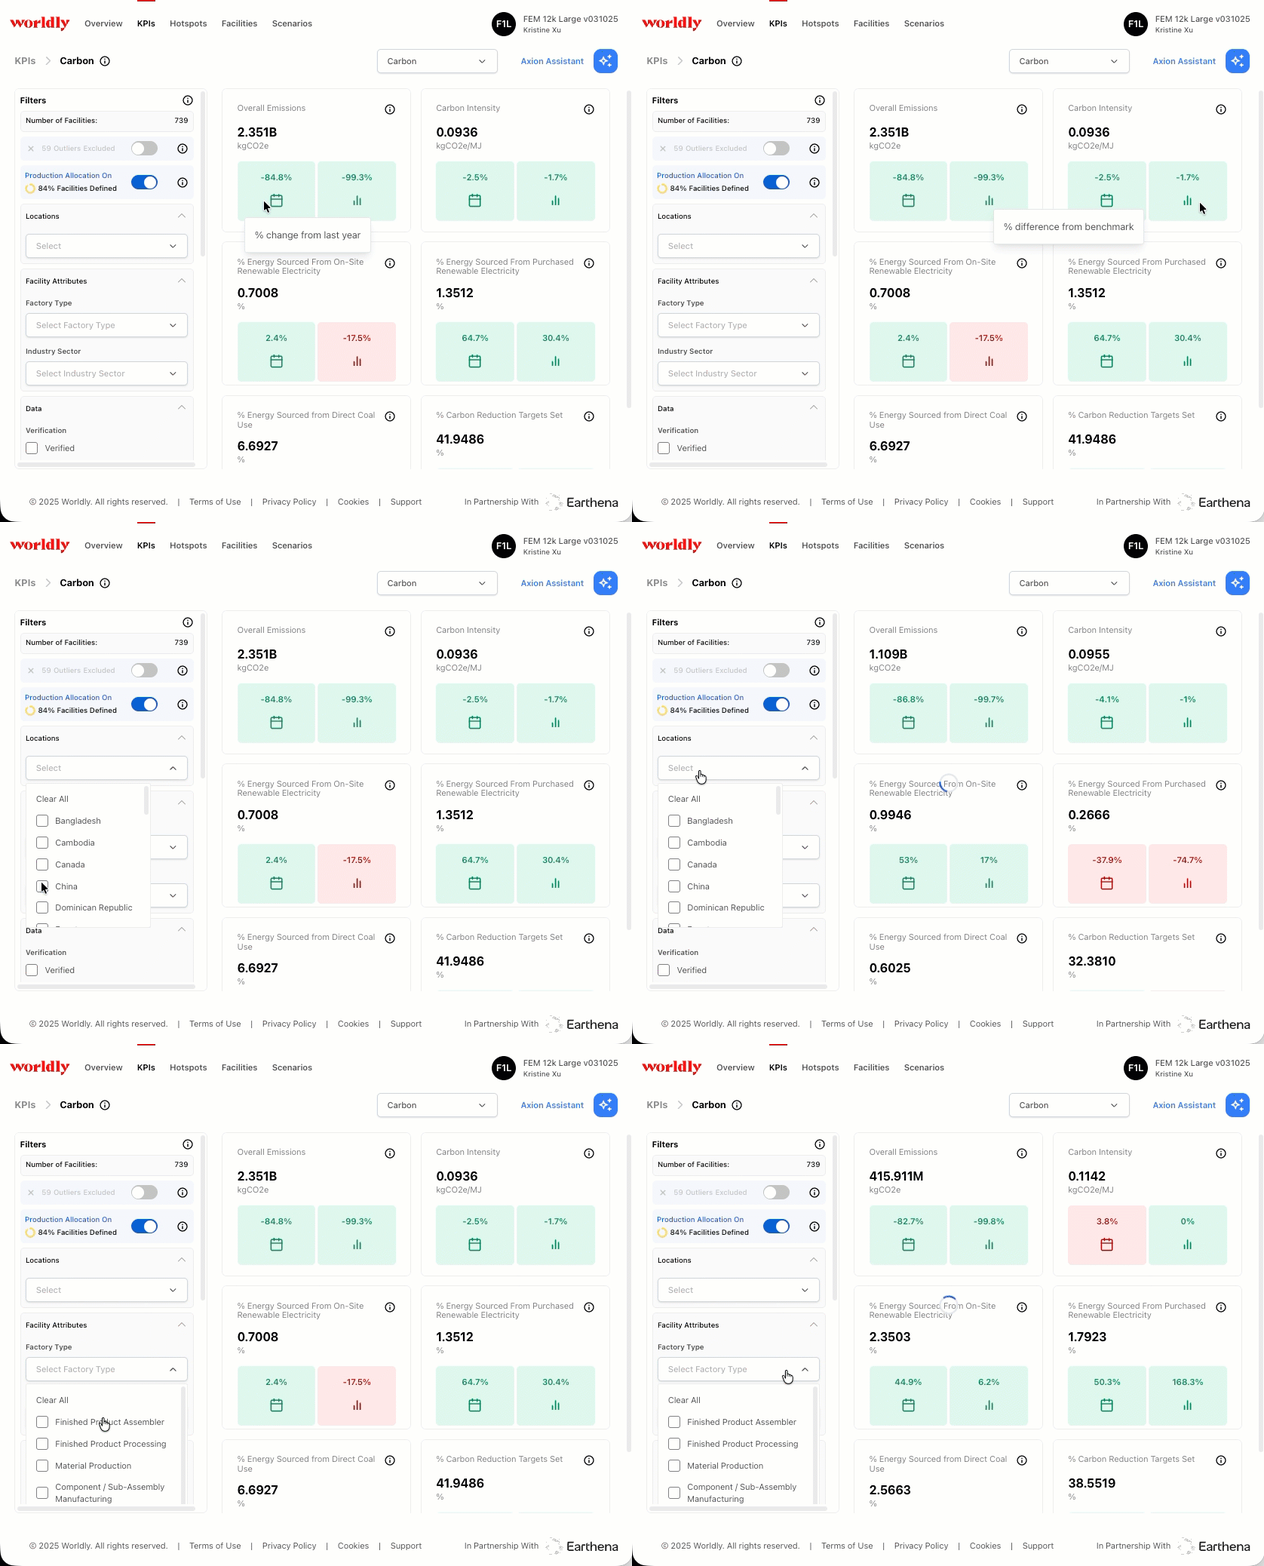
Change views by selecting between the Risk Areas.
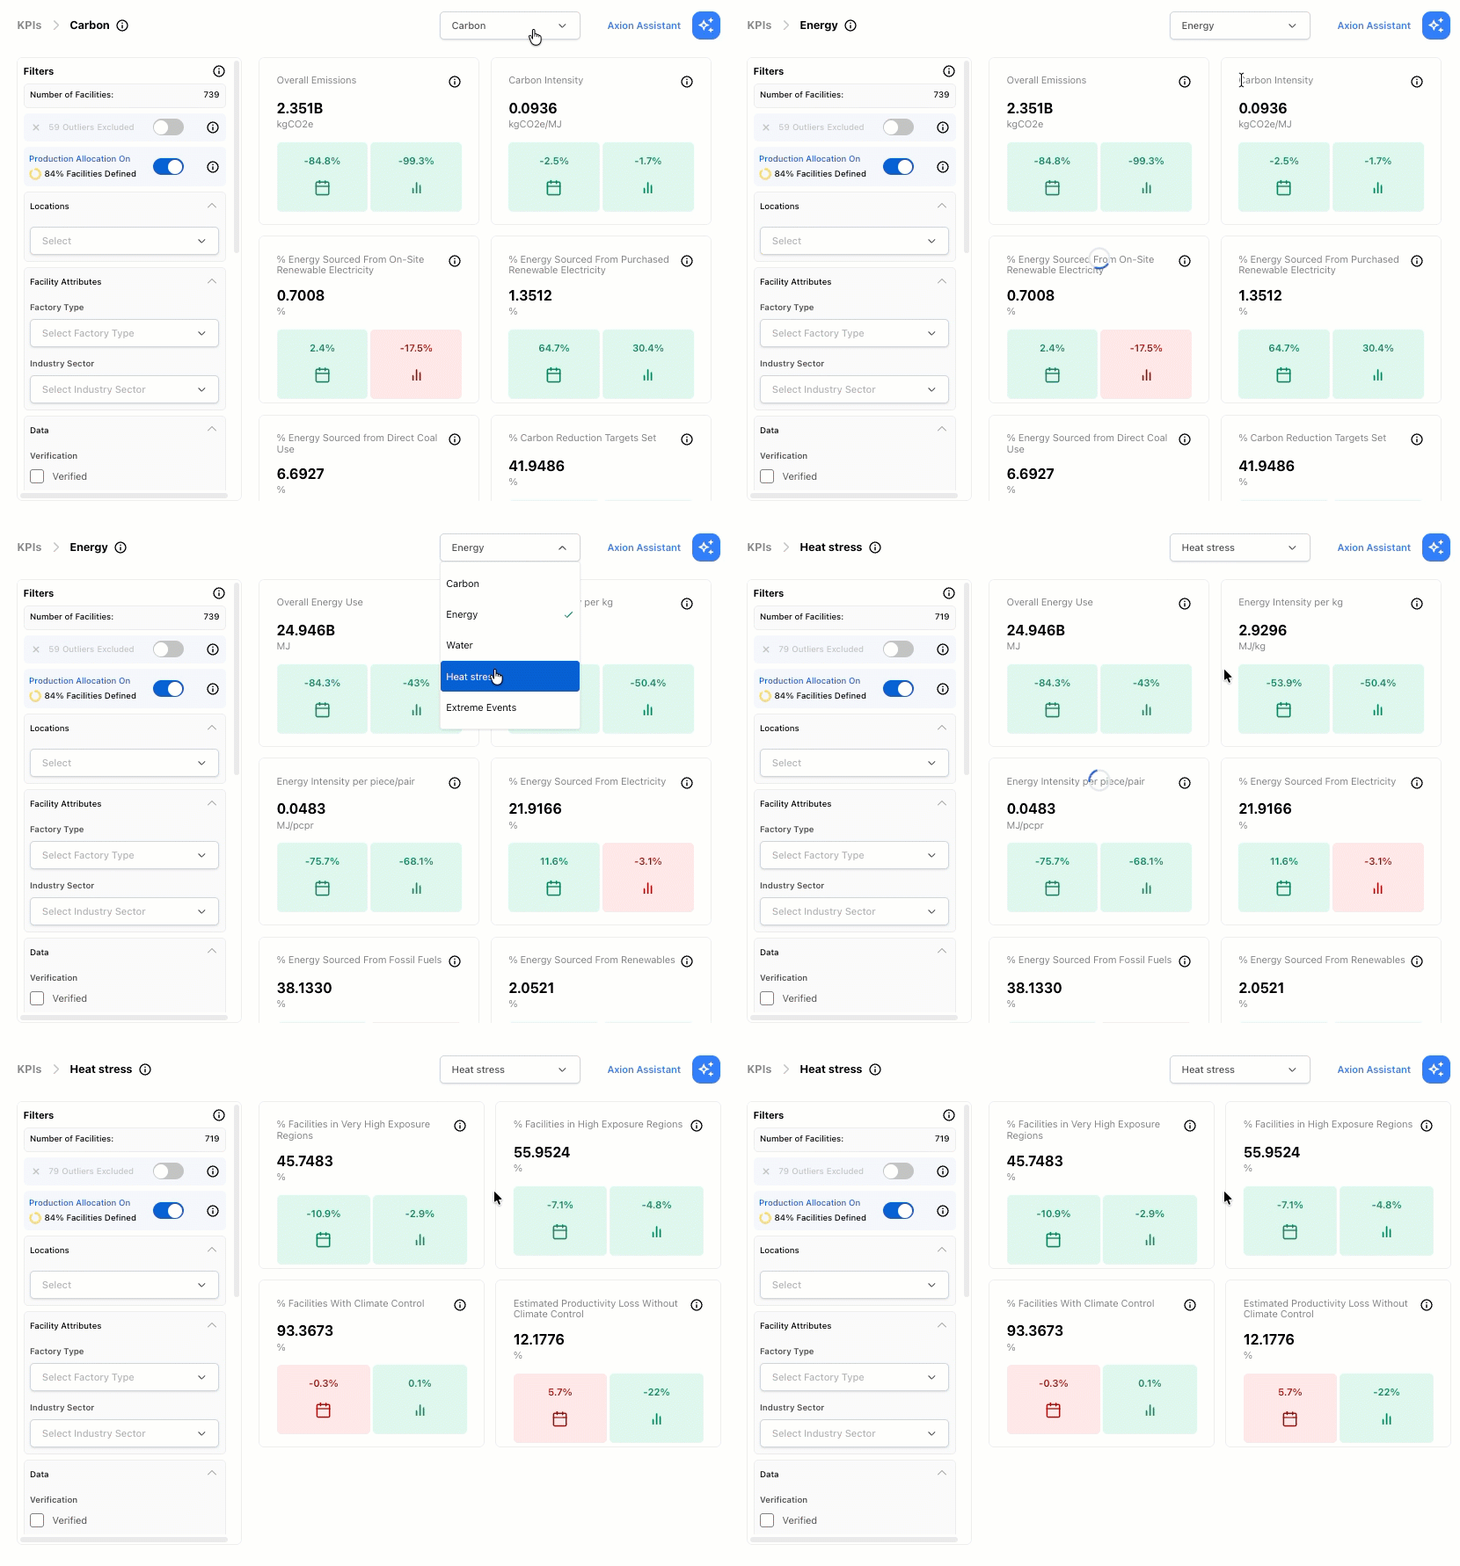
KPI Cards
The Extreme Events Risk Area has the following KPI Cards:
- % Facilities in Very High Flood Risk Regions - The percentage of facilities projected to have a very high risk of disruption caused by riverine flooding within the selected time period.
- % Facilities in Very High Wildfire Risk Regions - The percentage of facilities projected to have a very high risk of disruption caused by wildfires within the selected time period.
- % Facilities in Very High Extreme Wind Risk Regions - The percentage of facilities projected to have a very high risk of disruption caused by extreme wind speeds within the selected time period.
- % Facilities in High Flood Risk Regions - The percentage of facilities projected to have a high risk of disruption caused by flooding within the selected time period.
- % Facilities in High Wildfire Risk Regions - The percentage of facilities projected to have a high risk of disruption caused by wildfires within the selected time period.
- % Facilities in High Extreme Wind Risk Regions - The percentage of facilities projected to have a high risk of disruption caused by extreme wind speeds within the selected time period.
At the top of the dashboard, each KPI Card highlights a different critical metric for tracking progress.
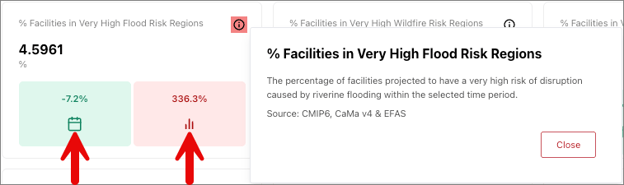
Each KPI card’s color-coding helps to quickly identify areas of concern versus those performing well. In addition to the KPI value, each card also includes:
- Year-over-year changes symbolized by the calendar icon, which show the % change from last year.
- Peer comparison that benchmarks against similar companies in your industry, symbolized by the three vertical bars and show the % difference from benchmark.
- Information tooltip that defines each KPI Card, as well as the source for each KPI.
Filters
The left-hand filter column automatically updates all metrics throughout the dashboard to reflect the filtered data set. Filters that are applied once are applied to all tabs within Worldly Axion. The dashboard filters enable users to organize and slice the data to quickly determine which facilities are best suited for intervention.
Adjust these filters to model different future states by country, facility type, production process and year. This enables more specific scenarios by facility, region or other combination of facilities based on filters. Further detail on how these metrics are defined can be found in the Methodology.
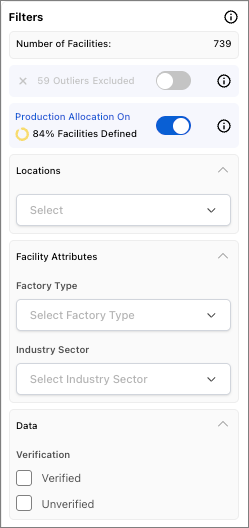
100% of production is allocated to your account if not defined or if turned off. Currently only share recipients can define their own FEM allocations, not facilities themselves. It may take an hour for new allocations to show up here in Insights Hub.
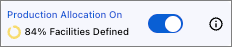
The color-coded widget corresponds with the percentage of facilities with production volume allocation defined.
- Red = 0 - 50%
- Yellow = 51 - 99%
- Green = 100%
- Factory Type - Select the applicable facility types.
- Industry Sector - Select the applicable industry sectors.
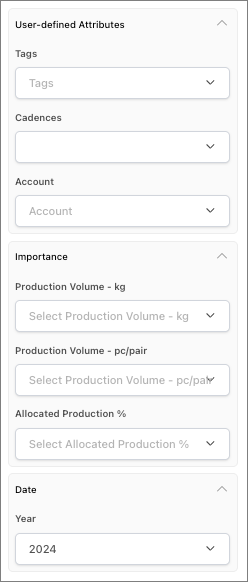
In addition to the production volume "bands" (1k-150k, etc.), there are options for 0 and 1-1k.
Select these options to easily view and/or exclude outliers with very low or very high production volume in kilograms.
Additionally, Allocated Production %, Production Volume (kg), and Production Volume (Pc-Pr) are inherently connected to the facility type. When they are selected, whole facilities will not be shown in the dashboard, but rather only those facility-facility type pairs that meet the criteria.
In addition to the production volume "bands" (1k-150k, etc.), there are options for 0 and 1-1k.
Select these options to easily view and/or exclude outliers with very low or very high production volume in pieces or pairs.
Additionally, Allocated Production %, Production Volume (kg), and Production Volume (Pc-Pr) are inherently connected to the facility type. When they are selected, whole facilities will not be shown in the dashboard, but rather only those facility-facility type pairs that meet the criteria.