
Table of Contents
- Introduction
- Getting Around the Dashboard
- Profile Status Card
- Key Performance Indicator Cards
- Compliance Over Last 3 Months
- Industry Benchmarking
- Supply Chain Overview
Introduction
Your Home Dashboard is now your central hub for chemical compliance. Track your compliance, score, and supply chain — all in one place through a single, easy-to-navigate interface.
What's New:
- Profile score & badge (New/Bronze/Silver/Gold)
- Monthly compliance, CIL status, and SDS coverage at a glance
- Industry benchmarking — see how you compare
- Personalized tips to improve your score
This guide explains each section, what the metrics mean, and how to improve your compliance score and data quality.
The dashboard refreshes within 2 hours after a new inventory upload.
Need Help? Check out the quick video walkthrough, go through this guideline, or use our chatbot in the bottom right of the screen for quick responses.
Getting Around the Dashboard
Sidebar Navigation
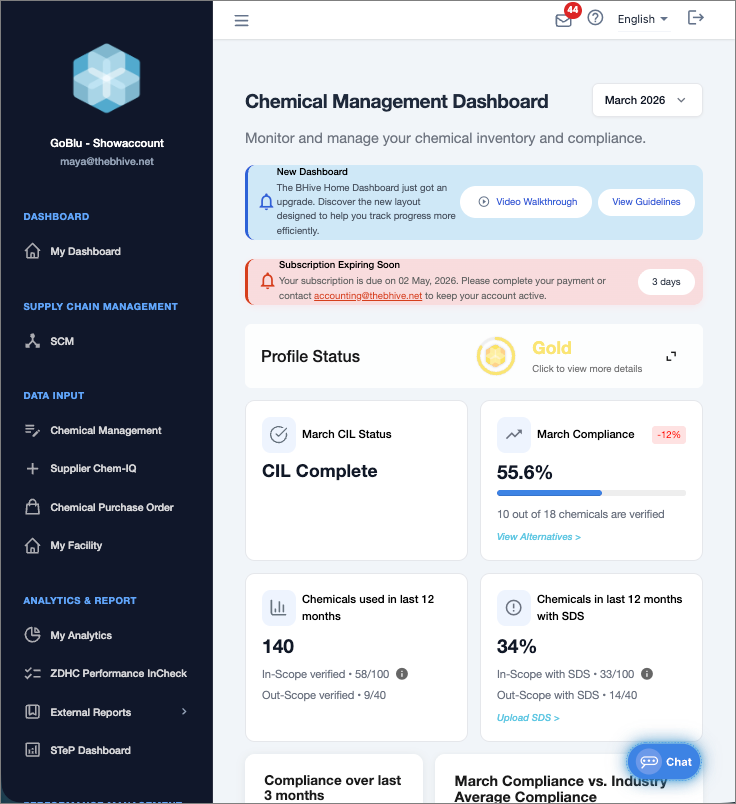
The dark sidebar on the left side is your primary navigation menu. It is always visible regardless of which page you are on. The Chemical Management Dashboard loads first when you log in.
Top Navigation Bar
The white bar at the top of the content area contains the following controls from left to right:
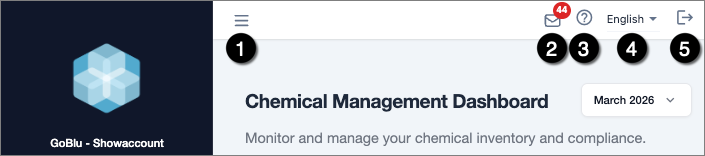
- Menu toggle: Collapses or expands the sidebar to give you more screen space.
- Notifications: Displays system alerts. A red badge shows the number of unread notifications.
- Help Center: Find all training materials here.
- Language Selector: Set automatically to your profile language settings (English by default); other languages can be selected from the dropdown.
- Logout icon: Safely signs you out of the platform.
Month Selector
In the top-right corner of the main content area, you will see a date picker (e.g. “March 2026”). Clicking it lets you switch the dashboard view to a different month.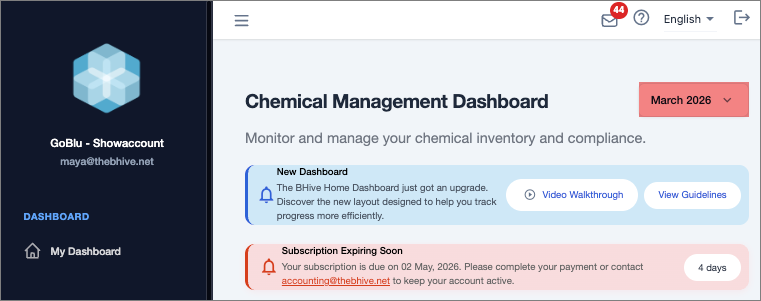
How the Active Month Works
- The dashboard always displays data for the most recently active upload month.
- Factories are expected to upload each month’s chemical inventory between the 1st of the month and the 15th of the following month.
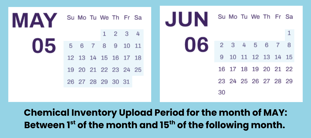
- The active month remains open until the 15th of the following month. For example, if today is any date in June (up to the 15th), May is still the active upload period – so the dashboard defaults to showing May’s data.
- When you select a past month, the monthly KPI cards (CIL Status, Compliance Rate, Total Chemicals, and SDS Coverage) update to reflect that period.
- Note: The Compliance over Last 3 Months chart and all metrics based on a 12-month rolling window (upload frequency, average compliance, total chemicals) are fixed to the current trailing period and do not update when switching months.
Profile Status Card
The Profile Status card is the first section below the alerts. It gives you a rolled-up view of your factory’s overall performance expressed as a single badge tier.
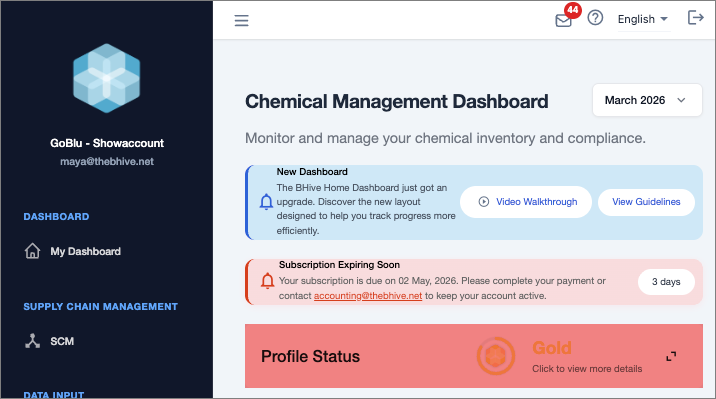
Badge Tiers
Your factory earns a badge based on a combined Profile Score. The four tiers are:



How the Score is Calculated
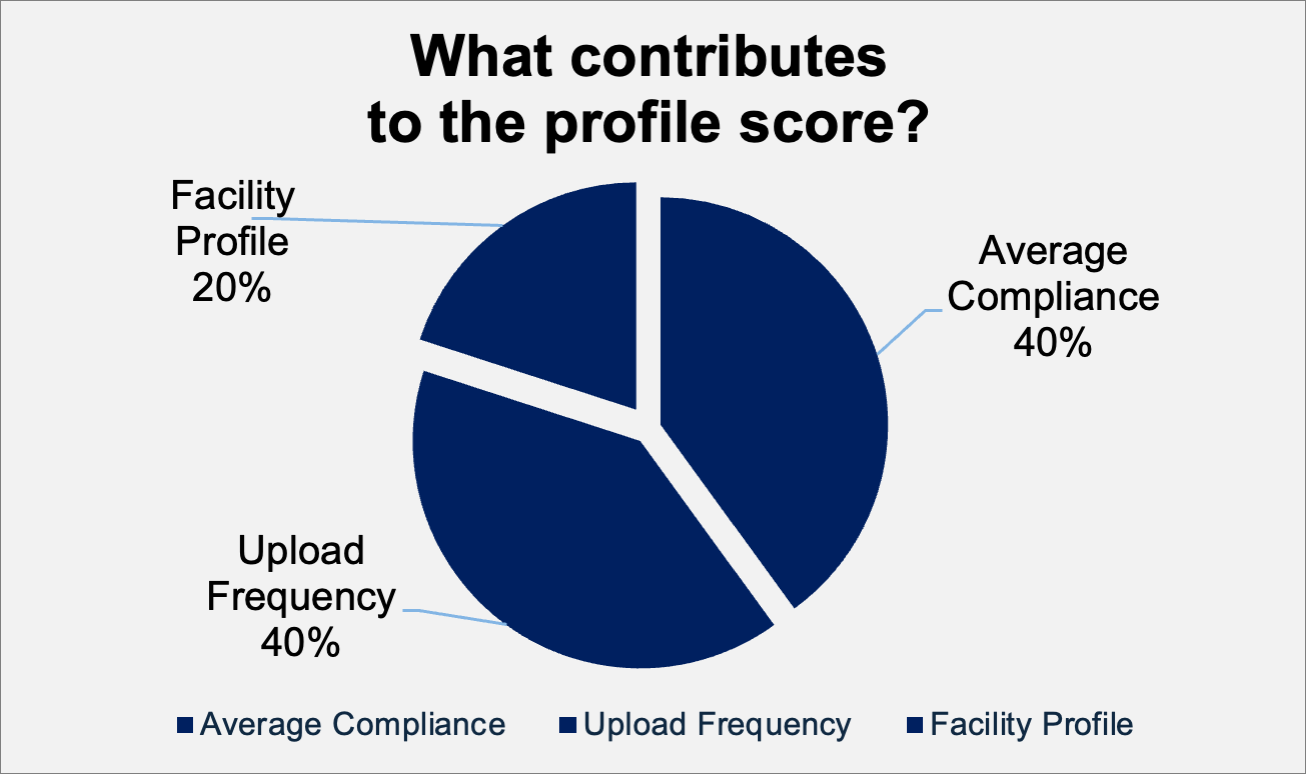
The Profile Score is a weighted combination of three components
The percentage of your in scope chemicals that are ZDHC-verified, averaged over the last 12 months.
Calculated as: (Verified Chemicals/Total InScope Chemicals) x 100
Displayed with a blue progress bar.
How consistently you upload your chemical inventory each month. Scoring:
- 1-6 uploads/year = 50%
- 7-10 uploads/year = 80%
- 11-12 uploads/year = 100%
Displayed with a cyan progress bar.
How completely you have filled in your facility profile. There are four required fields, each worth 25%:
- Production Volume
- Machine Park Inventory
- Manufacturing Processes
- Processed Materials List
Displayed with a purple progress bar.
To expand the full breakdown view with individual progress bars, select the expand icon in the upper right corner of the Profile Status card.

Key Performance Indicator Cards
Below the Profile Status section, four KPI cards provide a quick snapshot of this month’s most important figures.
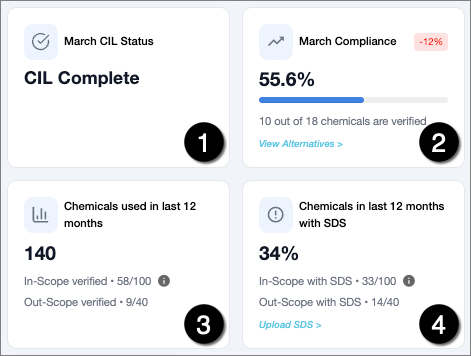
1. Monthly CIL Status
Shows whether your Chemical Inventory List (CIL) for the active month has been completed, and whether an InCheck report has been generated for InCheck subscribers.
- CIL Completed: Your inventory has been uploaded and marked complete for this month.
- CIL Not Completed: Either you haven't uploaded your inventory yet, or your data has been uploaded but not yet toggled as complete. Both steps are required; doing only one will leave the status as not completed.
- InCheck Not Generated: (InCheck subscribers only) your inventory exists, but no InCheck report has been generated for this period yet.
The card also shows how many days remain before the upload deadline for the current period. Select Complete Inventory > to go directly to the upload page.
2. Monthly Compliance
Shows the percentage of InCheck Scope chemicals in this month’s inventory that are ZDHC-verified. Formula: Verified Chemicals ÷ Total Chemicals × 100.
- A green badge indicates your compliance improved compared to the previous month.
- A red badge indicates your compliance declined compared to the previous month.
- The subtitle tells you the exact counts (ex: "0 verified").
- Click View Alternatives > to see recommended ZDHC-verified substitutes for non-compliant chemicals.
- If all chemicals in your CIL are out of scope, no compliance percentage will be displayed.
3. Chemicals used in last 12 months
Displays the total number of unique chemical products used at your facility in the last 12 months.
- The subtitle shows in-scope and out-of-scope verified counts.
4. Chemicals in last 12 months with SDS
Shows what percentage of your chemicals in the last 12 months have a Safety Data Sheet (SDS) on file.
- The subtitle provides exact counts for total with SDS and in-scope/incheck scope with SDS.
- Select Upload SDS > to open the document upload interface and attach missing SDS files.
What is In Scope/InCheck scope chemicals
The ZDHC Performance InCheck scope defines which chemicals in your inventory are included in the compliance evaluation:
In Scope (Included in InCheck Evaluation)
These chemical categories will be evaluated:
- Production (Dyes, Pigments, Auxiliaries)
- Solvent Based Chemicals (used for production)
- Functional Finishing
- Water Treatment Chemicals (except commodity chemicals)
Out of Scope (Automatically Excluded)
These categories are not required by ZDHC and will be excluded from the evaluation:
- Bulk / Commodities
- Lab / Testing chemicals
- Cleaning Agents / Maintenance Chemicals
- Developing / Cleaning Printing Screen
Compliance Over Last 3 Months
This stacked bar chart shows your compliance trend over the three most recent months.
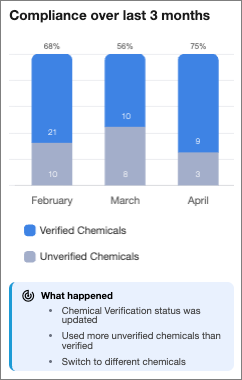
Each bar is divided into two segments:
- Blue segment: Verified chemicals (ZDHC-compliant)
- Gray segment: Unverified chemicals (not yet compliant)
The percentage label above each bar represents the compliance rate for that month. Hover over a bar to see the exact verified and unverified chemical counts in a tooltip.
Industry Benchmarking
The Industry Benchmarking card compares your compliance rate for the selected month against other factories in your country that use the platform. The dashboard always displays data from the most recently active upload month.
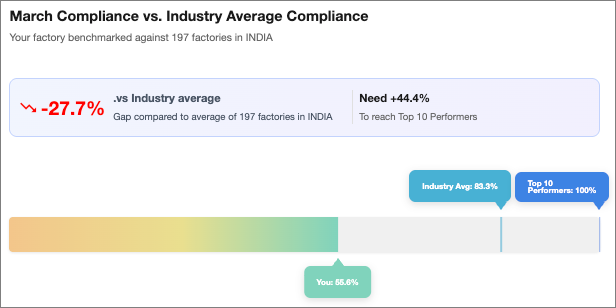
Reading the Summary Panel
Reading the Gradient Bar
The horizontal gradient bar gives you a visual sense of where you sit in the performance spectrum.
- Left side: Low performers
- Centre: Average performers
- Right: Top performers
Two callout markers are shown on the bar: Industry Avg and Top 10 Performers. Your factory’s current position is shown by a separate marker labelled You: X%.
Tip: Using the benchmark to set targets
- If your marker sits below the Industry Avg callout, prioritize increasing your ZDHC compliance rate before the next monthly upload.
Improve compliance options:
Option 1 – Upload a compliance document
- Contact your chemical supplier to obtain a test report or certificate
- Upload it via My Inventories > Overview > Monthly Inventory Summary (click the upload icon next to the chemical)
- The BHive team will review it within up to 6 weeks
- In your next inventory, re-add the chemical from the BHive database (do not copy from previous inventories) Reasons for unverified chemicals
Option 2 – Substitute the chemical
- Go to Performance Management > Substitution to find safer alternatives via resources like OEKO-TEX, GOTS, ChemSec Marketplace, or Scivera Correct Data Input
Option 3 – Set up a Corrective Action Plan (CAP)
- Tick the box next to an unverified chemical in your inventory summary and click Add to CAP
- Choose a remediation: Stop using the product, Substitute it, or Update compliance information
- This helps you track progress and shows your brand you are actively improving Best Practices
Supply Chain Overview
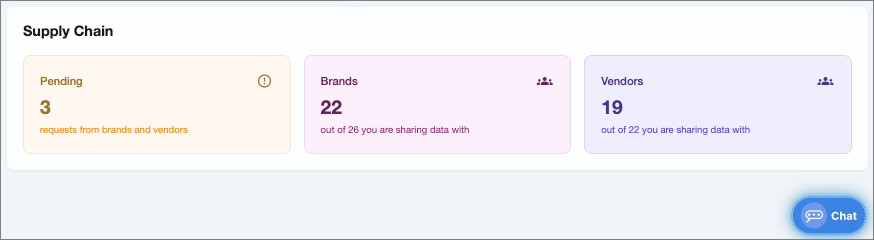
At the bottom of the dashboard, the Supply Chain section summarizes your data-sharing relationships. 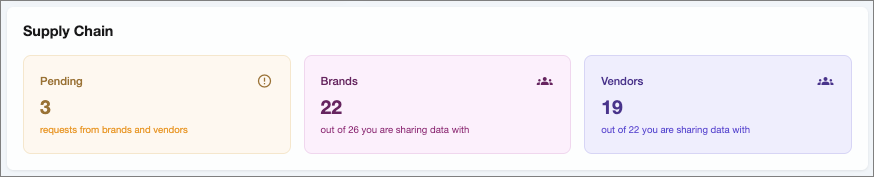 Three cards are displayed side by side, each with a distinct color:
Why pending requests need attention
- Unaccepted data-sharing requests mean that brands cannot see your latest compliance data
- Aim to keep the Pending count at zero by reviewing requests promptly in the Supply Chain module